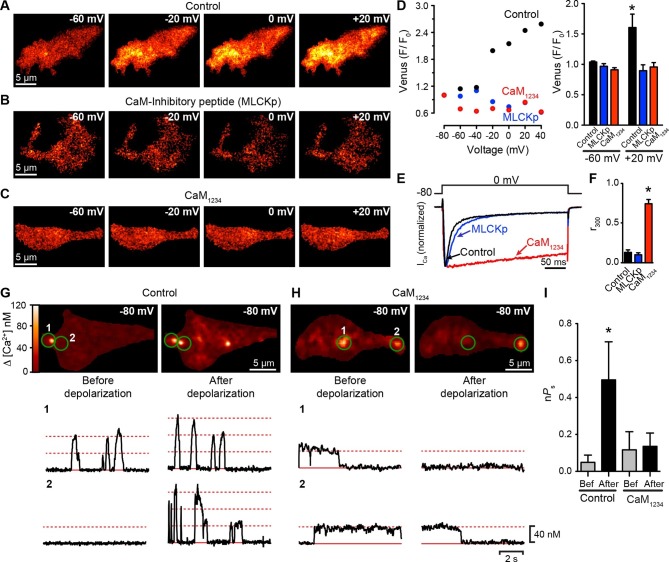
Figure 6. CaV1.3S coupling requires Ca2+-CaM.
(A–C) TIRF images of Venus fluorescence reconstitution in the presence of 20 mM Ca2+ in tsA-201 cells expressing (A) CaV1.3S-VN and CaV1.3S-VC, (B) CaV1.3S-VN and CaV1.3S-VC and dialyzed with the MLCK peptide (MLCKp), (C) CaV1.3S-VN, CaV1.3S-VC and CaM1234. Fluorescence reconstitution was measured in response to depolarizing voltage steps from a holding potential of -80 mV to test potentials of -60 mV to +60 mV. (D) Voltage-dependence of Venus fluorescence reconstitution in the presence of 20 mM Ca2+ for control (black), MLCKp (blue), and CaM1234 (red) cells shown in (A–C) (left). Bar plot of averaged Venus fluorescence in the presence of 20 mM Ca2+ at -60 mV and +20 mV (right). Bars are averages ± SEM (*p<0.05, n = 5 cells). (E) Normalized ICa currents evoked by a 300-ms depolarizing pulse from a holding potential of -80 mV to a test potential of 0 mV in control (black), MLCKp (blue), and CaM1234 (red) cells. Currents analyzed for these experiments were in a range between 0.3 and 1.2 nA (F) Bar plot of the mean fraction of r300 at 0 mV. Bars are averages ± SEM (*p<0.05, n = 5 cells). (G) Top: TIRF images of CaV1.3S sparklets in tsA-201 cells expressing CaV1.3S-VN and CaV1.3S-VC (Control). Sparklets were recorded at -80 mV in 20 mM Ca2+ before depolarization (left) and after the same depolarization protocol used in (A–C) (right). Green circles indicate sparklet sites. Bottom: Traces of the time course of [Ca2+]i in the corresponding sparklet sites 1 and 2. (H) TIRF images and time course of [Ca2+]i of CaV1.3S sparklets in tsA-201 cells expressing CaV1.3S-VN/CaV1.3S-VC and CaM1234. Format and protocol are as in (G). (I) Bar plot of the averaged CaV1.3S sparklet activity (nPs) before (gray) and after (black) depolarization. Bars are averages 5 cells ± SEM (*p<0.05).

