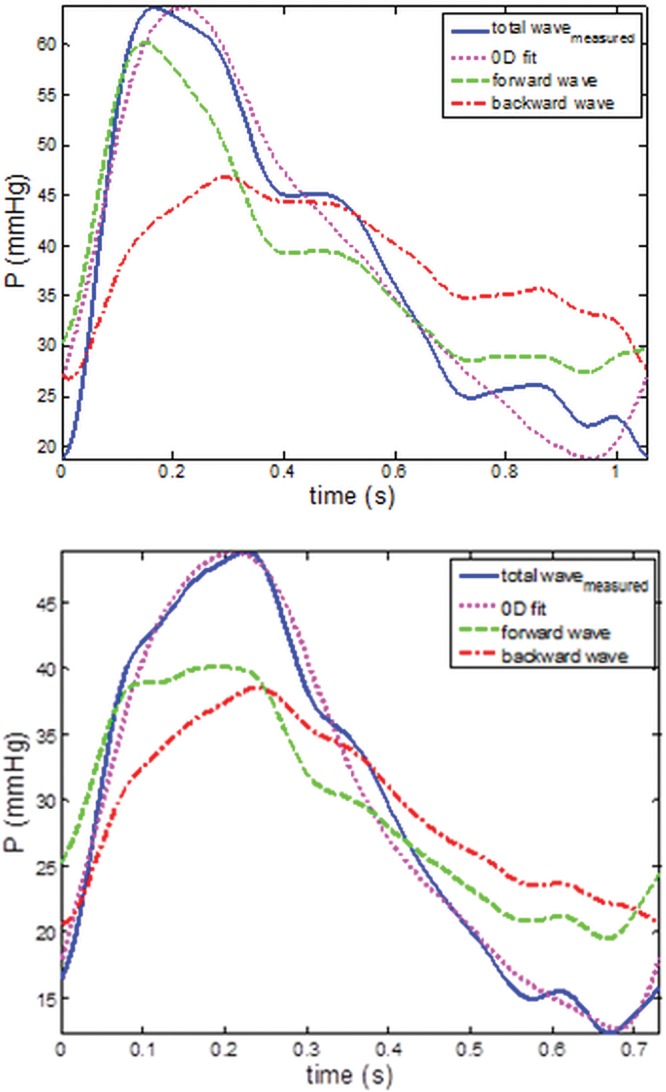
Figure 2.

Total (blue lines) pressure wave decomposition into forward (green lines) and backward (red lines) components for a no–pulmonary hypertension (PH; top) and a PH patient (bottom), obtained from applying the one-dimensional model. Total fitted pressure wave returned by the zero-dimensional (0D) model (magenta lines) for the same patients. The proportion of the backward wave component to the total wave is higher for the PH patient than for the no-PH patient. Good fit (root mean square = 0.08 and 0.04) is returned by the 0D model in both examples.
