
Figure 3.
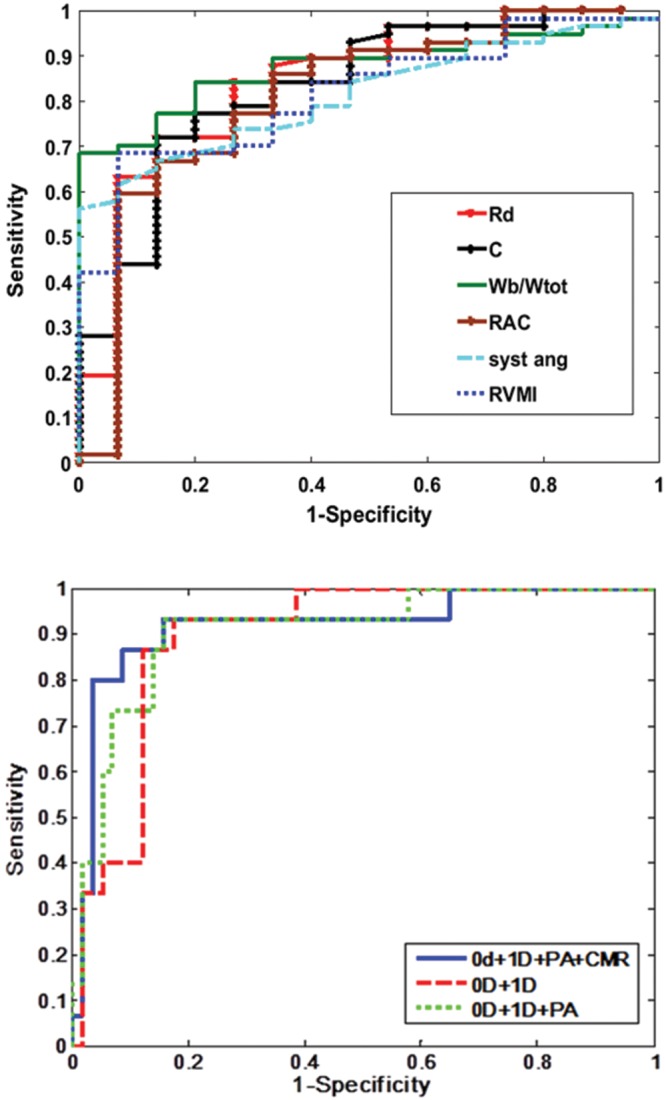
Top, receiver operator characteristic (ROC) curves corresponding to the parameters with area under the curve (AUC) > 0.8. Bottom, ROC curves for the random forest classification models. Top, 6 out of the 10 proposed computational and anatomy metrics had AUC > 0.8. Zero-dimensional (0D): Rd: distal resistance (red line), AUC = 0.85; C: pulmonary vascular compliance (black line), AUC = 0.83. One-dimensional (1D): Wb/Wtot: ratio of backward to total wave power (green line), AUC = 0.88; RAC: main pulmonary artery (PA) relative area change (brown line), AUC = 0.81; CMR: cardiac magnetic resonance imaging; syst ang: systolic septal angle (light blue line), AUC = 0.81; RVMI: right ventricle mass index (dark blue line), AUC = 0.81. Bottom, in-turn addition of the metrics improved the AUC. 0D and 1D metrics (red line), AUC = 0.89; 0D, 1D, and PA (green line), AUC = 0.9; all 6 parameters, 0D, 1D, PA, and CMR (blue line), AUC = 0.91.