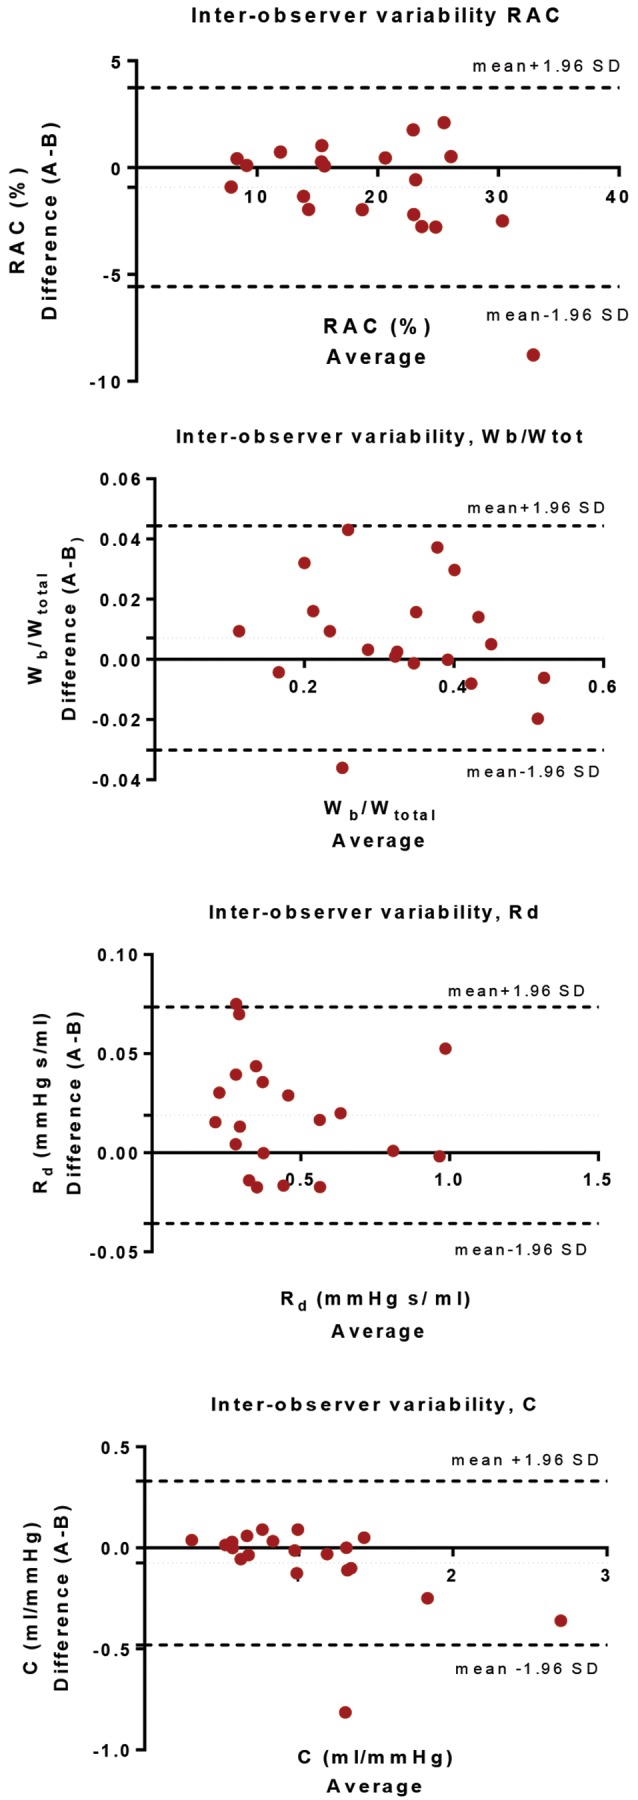
Figure A1.

Interobserver variability. Bland-Altman analysis for relative area change (RAC), ratio of wave power (Wb/Wtot), distal resistance (Rd), and pulmonary compliance (C) performed on 20 cases selected at random (using MATLAB) from the 72-patient cohort.
