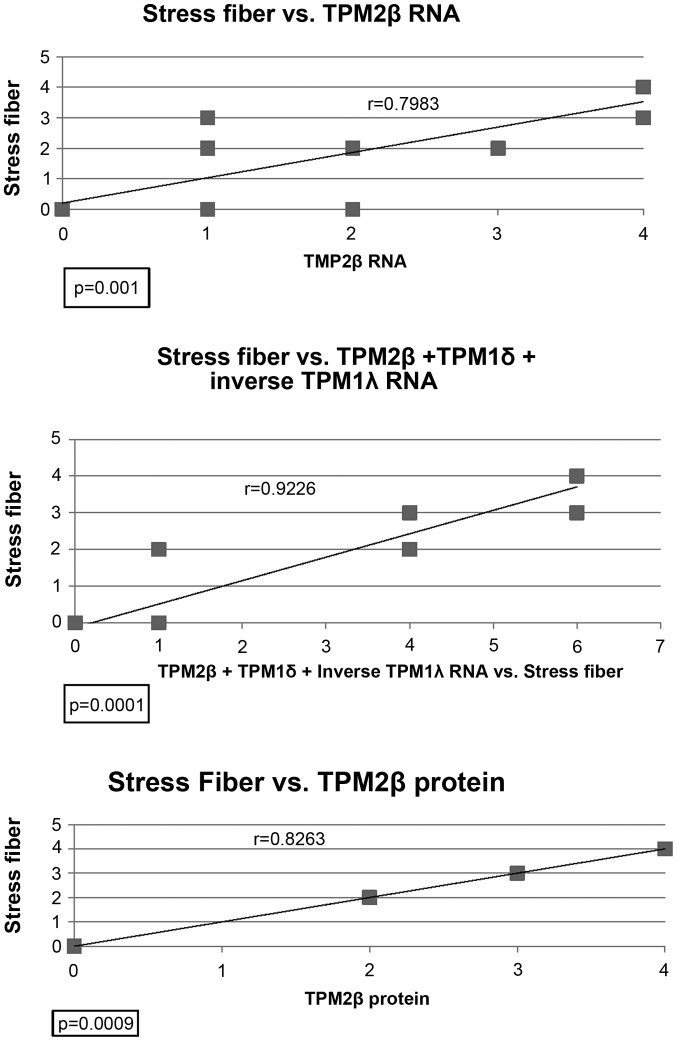
Figure 5.
Regression analyses of stress fiber formation vs. expression of TPM2β RNA, TPM2β protein, or TPM2β RNA plus TPM1δ RNA plus the inverse of TPM1λ RNA in the 12 human breast cell lines. Each box represents one, or more than one, cell line. Both TPM2β RNA and protein expression had high positive correlations with stress fiber formation (both p=0.001). The highest correlation with stress fiber formation (r=0.92) was observed when TPM2 RNA, TPM1δ RNA and the inverse of TPM1λ RNA were combined (p<0.001).

