Abstract
Non-thermal atmospheric pressure plasma has been widely studied in recent years in many fields, including cancer treatment. However, its efficiency for inducing apoptosis sometimes varies depending on the cell species and experimental conditions. The aim of this study was to elucidate what causes these differences in responses to plasma treatment. Using four ovarian cancer cell lines, the cell density had a markedly negative impact on the proliferation inhibition rate (PIR) and it was more obvious in OVCAR-3 and NOS2 cells. Furthermore, TOV21G and ES-2 cells were drastically sensitive to plasma-activated medium (PAM) compared with the other two cell lines. We demonstrated that the proportion of reactive oxygen species and cell number had a marked impact on the effect of PAM against ovarian cancer cells. Additionally it was suggested that the morphological features of cells were also closely related
Keywords: nonequilibrium atmospheric pressure plasma, epithelial ovarian cancer, morphology, apoptosis, susceptibility
Introduction
Plasma has been defined as ionized gas containing electrons, positive and negative ions, neutral atoms, and neutral and charged molecules (1). Because it has become possible to generate plasma at room temperature and atmospheric pressure with technical developments, plasma has been studied and applied in many medical fields, such as sterilization (2), implants (3), blood coagulation (4), and wound healing (5). Furthermore, the use of atmospheric pressure plasma has attracted much attention in cancer therapy as an innovative technology (6).
It has been reported that plasma generates a large amount of reactive oxygen species (ROS), leading to DNA damage and inducing the apoptosis of many types of cancer cells in vitro and in vivo (6–10). In addition, recent experimental evidence in a variety of tumors has led to the strong support of the hypothesis that plasma has a cytotoxic effect against cancer cells without damaging surrounding normal cells (11–13). This has attracted interest in identifying the mechanisms underlying the anticancer effect of this new technology and how to effectively apply it to clinical treatment. It has been suggested that various ROS and reactive nitrogen species that are generated by plasma could cause peroxidation of the lipid double membrane of cancer cells, resulting in elevation of intrinsic ROS and induction of apoptosis (7,14). Although every somatic cell possesses a detoxifying system against oxidative stress produced by aerobic metabolism and extrinsic stimuli, cancer cells have a higher basal ROS concentration compared with normal cells due to their active metabolic status (15). It is considered that this difference in basal ROS concentration makes cancer cells more sensitive to plasma. This may explain in part the mechanisms underlying the selective sensitivity of cancer cells to plasma. It is widely known that cancers are heterogeneous in terms of various aspects, including the intracellular ROS level according to their various metabolic activity and anti-oxidant capacity (16). According to these facts, it has been suggested that different cancer cells may exhibit a variety of susceptibilities to plasma treatment. However, many studies on plasma treatment have focused primarily on only one type of cancer cell. Taken together, a mechanistic explanation of these differences has remained elusive.
Moreover, it was suggested that the environmental condition including background fluid or cell number markedly influenced the plasma efficacy in addition to the type of cancer cell (12,17,18). Further investigations on the cause of these differences and how they might occur are urgently needed for clinical application and for optimizing the use of this new technology.
To clarify the different responses of cancer cells to plasma treatment, we assessed the impact of cell numbers and the morphological characteristics of cells using several ovarian cancer cell lines showing different plasma sensitivities. In addition, we performed these experiments using indirect plasma, which has been suggested to be comparable to direct plasma irradiation (10,19). Indirect plasma means that cells are exposed to liquid that has been exposed to plasma beforehand separately from the cells. It has been considered that ROS generated by plasma could be transferred and diffused in the medium. With this ROS-containing plasma-activated medium (PAM), the apoptosis of cancer cells could be induced (19). In this study, we demonstrated that the number and morphology of ovarian cancer cell lines were closely related to the sensitivity of the cancer cells to PAM treatment.
Materials and methods
Cell culture
Four human ovarian cancer cell lines were used. Three cell lines (OVCAR-3 TOV21G, and ES-2) were purchased from the American Type Culture Collection (ATCC; Manassas, vA, USA) and NOS2 cells which were derived from serous epithelial ovarian cancer (EOC) were established in our institute (20). These cell lines were all maintained in RPMI-1640 medium (Sigma-Aldrich, St. louis, MO, USA) supplemented with 10% fetal bovine serum (FBS) and penicillin-streptomycin at 37°C in a humidified atmosphere of 5% CO2.
Experimental system generation of PAM
We used a nonequilibrium atmospheric pressure plasma (NEAPP) system as a plasma-producing device. The details of this experimental NEAPP system were previously described (11). In brief, discharge conditions were in argon gas (2 standard liters/min; slm) excited by applying 10 kv of a 60-Hz commercial power supply to two electrodes with a distance of 8 mm. In brief, NEAPP with an ultra-high electron density (approximately 2×1016 cm−3) provided an ultra-high O density estimated to be ~4×1015 cm−3. Furthermore, the generation of reactive oxygen species (ROS), such as hydroxyl radicals, singlet oxygen radicals, nitrogen oxide and nitrogen, was confirmed by optical emission spectroscopy. We exposed the above NEAPP to RPMI-1640 without FBS separately from the cells, which was designated as plasma-activated medium (PAM). The separated distance between the plasma source and the medium (L) is critical to consistently reproduce data, and so all experiments were performed under a set condition, L=15 mm. The duration of plasma treatment ranged from 0 to 8 min. Six milliliters of RPMI-1640 medium was placed in a 60-mm dish. The center of each 60-mm dish was treated for several exposure times (0, 1, 3, 5, and 8 min) with NEAPP fixed above the dish at a single point, indicated by PAM-0, -1, -3, -5, and -8, respectively. For the control, we used 6 ml of RPMI-1640 medium blown by argon gas without the irradiation of NEAPP for an equal duration as PAM (argon-activated medium; Ar-AM). NEAPP exposure can cause changes to the media in regards to pH or temperature. We referred to these change in our previous manuscript, and they were almost negligible (11). ROS in medium were generated homogeneously due to the convective flow by gas or sufficient mixture before the addition to cells.
Treatment with TGF-β1
NOS2 cells were stimulated with recombinant human transforming growth factor-β1 (TGF-β1) (Wako Pure Chemical Industries, Osaka, Japan) at 10 ng/ml in RPMI-1640 supplemented with 2% FBS for 96 h. After a 96-h incubation with TGF-β1, the cells were washed with PBS and used for a number of assays.
Cell viability assay
To examine the influence of the cell density (cell number) on the effect of PAM, cells were plated in 96-well plates at a density of 2.5×10³, 5×10³, 7.5×10³, 1×10⁴, 1.5×10⁴ and 2.0×10⁴ cells/well in 100 µl of complete culture medium, respectively. On the following day, the cells were treated with PAM-3 or -5 (3 and 5 min/6 ml) for 24 h. In our previous study, we previously confirmed that there were no different effects between the untreated control and the Ar-AM-treated group (12). Thus, we used Ar-AM as a more appropriate control. Control cells were treated with Ar-AM-3 or -5 in the same way as PAM. Then, the viability of cells was measured by the MTS assay (Aqueous One Solution Cell Proliferation Assay kit; Promega, Madison, WI, USA), according to the manufacturer's instructions. Absorbance was measured at 490 nm with a microplate absorbance reader (El×808; BioTek).
Furthermore, to assess the impact of morphological change after a 96-h incubation with TGF-β1, NOS2 cells were washed with PBS and seeded in 96-well plates at a density of 1×10⁴ cells/well in 100 µl. On the following day, the cells were treated with PAM-0, -1, -3, -5, and -8 and Ar-AM-0, -1, -3, -5, and -8, for 24 h and then assessed by the MTS assay, as described above.
The proliferation inhibition rate (PIR) was calculated according to the following formula:
Each cell number was duplicated in 3 wells. Experiments were performed in triplicate.
Cell imaging assay
The morphological changes in the cells were observed after PAM treatment, and the cells were seeded in a 12-well plate at a density of 2.7×10⁴ (7.5×10⁴/cm2) and 2.1×10⁵ (6.0×10⁵/cm2) cells per well, adjusted to the consistent density of 2.5×10³ and 2.0×10⁴ cells/well in 96-well plates, respectively. Then, after being cultured for 24 h at 37°C, the cells were exposed to PAM-3 and Ar-AM-3 and incubated for another 24 h. The cells were subsequently observed with a microscope.
TUNEL assay
Apoptotic cells were identified using the In Situ Cell Death Detection kit, Fluorescein (Roche Applied Science, Mannheim, Germany), according to the manufacturer's instructions. EOC cells (4×10⁴/well) were seeded in a collagen-coated 8-well cover glass, incubated for 24 h, and then treated with NEAPP-AM-3 or Ar-AM-3. After 24 h of incubation, the cells were fixed with 4% paraformaldehyde and the TUNEL reaction mixture was added. After being incubated in a chamber for 60 min at 37°C, the cells were observed under a fluorescence microscope (Olympus, Japan) at 4–8 fields. This experiment was repeated at least two times. The apoptosis rate was calculated according to the following formula: Apoptosis rate = the number of florescence cells/the number of total cells in each view.
Western blot analysis
For western blotting of E-cadherin, EOC cells were plated in 10-cm dishes. On the following day, the cells were grown to 70–80% subconfluency and treated with lysis buffer containing 1% Triton X-100 in PBS and protease inhibitor mixture tablets (Roche, Barcelona, Spain). For the TGF-β1-treated cells, total cell lysates were isolated in the same way after a 96-h incubation with TGF-β1.
Samples were electrophoresed on a 10% SDS-polyacrylamide gel and transferred electrophoretically to Immobilon membranes (Millipore, Bedford, MA, USA). After blocking in blocking solution (5% nonfat dry milk/0.1% Tween-20/PBS), the membranes were incubated overnight with a recommended dilution of primary antibodies. We used the following antibodies: anti-E-cadherin (Santa Cruz Biotechnology, Dallas, TX, USA) and anti-β-actin (Sigma-Aldrich). The primary antibodies were washed in 0.05% Tween-20/PBS and then incubated with horseradish peroxidase-conjugated secondary antibody. Immunoreactive proteins were stained using a chemiluminescence detection system (ECL; Amersham, Arlington Heights, Il, USA). An Ab against β-actin (AC-15; Sigma-Aldrich) was used to standardize the protein loading.
Migration assay
Cell migration was assayed using Boyden chambers. NOS2 and ES-2 cells were applied in the upper chamber at a final density of 2.5×10⁵ cells/ml in 200 µl of RPMI-1640 serum-free medium. We set up 800 µl of RPMI-1640 supplemented with 5% FBS in the lower chamber. After a 6-h incubation, the remaining cells on the upper surface of the filters were removed by wiping with cotton swabs, and the migrating cells on the lower surface underwent May-Giemsa staining. The number of cells on the lower surface of the filters was counted under a microscope (magnification ×100), and we carried out four individual experiments for the migration assay in duplicate.
Statistical analysis
Data are presented as means ± SD from at least three independent experiments. Statistical analysis of the data was performed using the Student's t-test. Differences between groups were considered significant at P<0.05.
Results
The association between cell density and PAM susceptibility
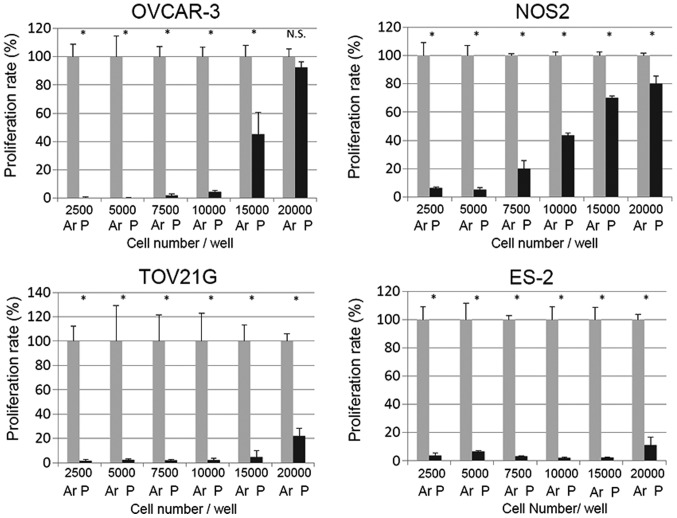
We first examined the impact of the relative cell number on PAM efficacy in the different EOC cell lines. OVCAR-3, NOS2, TOV21G and ES-2 cells were seeded onto 96-well plates at a density of 2.5×10³, 5×10³, 7.5×10³, 1×10⁴, 1.5×10⁴ and 2.0×10⁴ cells/well one day before treatment. Ar-AM was used as a control to exclude the gas effect of PAM. Cells were treated with PAM-3 and Ar-AM-3 and incubated for another 24 h. Then, cell viability was evaluated as described in the cell viability assay. Compared with the proliferation rate of cells treated with Ar-AM-3, PAM treatment in OVCAR-3 cells resulted in a significant reduction in cell proliferation when cells were seeded at the density of 1×10⁴ cells/well (Fig. 1). By increasing the cell number to 2.0×10⁴ cells/well, the number of viable cells was significantly increased (Fig. 1). The same tendency was also observed in NOS2 cells. In contrast, although the growth-inhibitory effect decreased almost in a cell density-dependent manner, TOV21G and ES-2 cells showed marked sensitivity to PAM, and the impact of the cell number on the PAM effect was smaller than that of the former two cell lines.
Figure 1.
The effect of PAM on cell viability at each cell density. OVCAR-3, NOS2, TOV21G and ES-2 cells were plated in 96-well plates at a density of 2.5×10³, 5×10³, 7.5×10³, 1×10⁴, 1.5×10⁴, and 2.0×10⁴ cells/well, respectively. On the following day, the cells were treated with PAM-3 (P) for 24 h. Control cells were treated with Ar-AM-3 (Ar). Then, the effect of PAM on the viability of cells was measured by the Aqueous One Solution Cell Proliferation Assay kit. Three independent experiments were performed. Error bars represent SD. *P<0.05, **P<0.01. N.S., not significant.
Morphological changes induced by PAM at each cell density
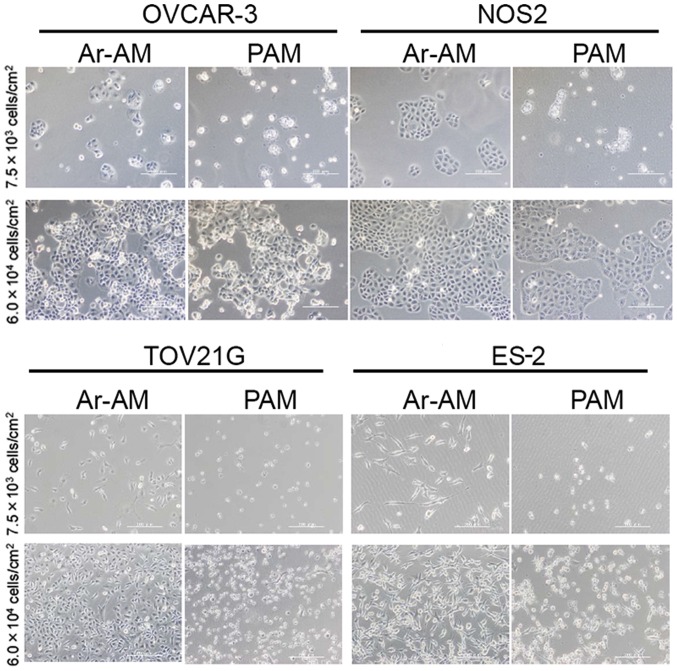
To visualize the impact of the cell density on the anti-proliferation of PAM by the cell viability assay, we assessed the morphological changes in OvCAR-3 and NOS2 cells, whose sensitivity to PAM was markedly affected by the cell density. We seeded both cell lines at densities of 7.5×10³/cm2 and 6.0×10⁴/cm2 in 12-well plates, which were equivalent to ~2.5×10³/well and 2.0×10⁴/well in a 96-well plate, respectively. After a 24-h incubation, the cells were exposed to PAM-3 and Ar-AM-3 for another 24 h and observed under a microscope. In both cell lines, most cells that had been seeded at the density of 7.5×10³/cm2 showed morphological changes such as shrinking, blebbing, and detachment. On the contrary, most of the cells that had been seeded at the density of 6.0×10⁴/cm2 survived in the presence of PAM and there were no marked changes observed in their morphology (Fig. 2).
Figure 2.
Microscopy images of OVCAR-3 and NOS2 cells treated with PAM and Ar-AM. Upper panels show the cells seeded at a low density (7.5×10³/cm2) and lower panels at a high density (6.0×10⁴/cm2). Cells were plated in 12-well plates at the indicated density, respectively, treated with PAM-3 and Ar-AM-3 for 24 h, and observed with a microscope.
The proliferation inhibition rate (PIR) by PAM in EOC cells
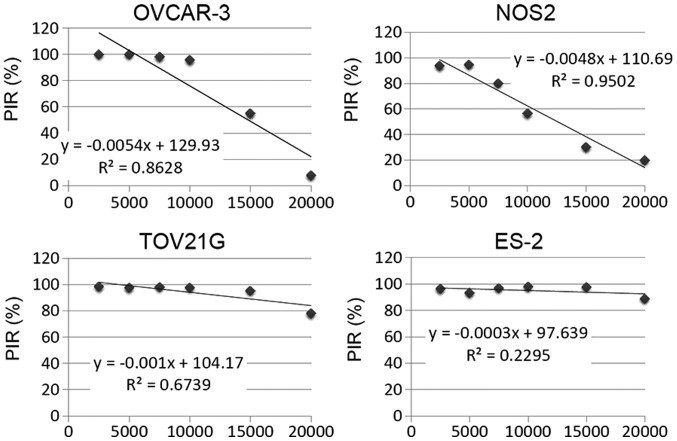
To clarify the results of Fig. 1 and compare the impact of the cell density on the sensitivity to PAM among cell lines, we calculated the PIR as described in Materials and methods. We also calculated the inclination of the approximate straight line based on these PIR graphs. The results were −5.4×10⁻⁴, −4.8×10⁻⁴, −1.0×10⁻⁴ and −3.0×10⁻⁵ in the OVCAR-3, NOS2, TOv21G and ES-2 cells, respectively (Fig. 3). These results indicated that the cell density had a markedly negative impact on PIR and it was clearer in OVCAR-3 and NOS2 cells. Furthermore, TOv21G and ES-2 cells were highly sensitive to PAM compared with the other two cell lines.
Figure 3.
Proliferation inhibition rate (PIR) in the four EOC cell lines. PIR was calculated according to the formula: PIR = (ODAr−AM − ODNEAPP−AM)/ODAr−AM × 100.
Stronger PAM inhibits the proliferation of EOC cells even when seeded at a high density
Since it has been demonstrated that ROS in PAM induced the apoptosis of cells and this was cancelled out by N-acetyl cysteine, which is an antioxidant agents, we hypothesized that the intrinsic antioxidant that each cell secreted reduced the ROS contained in PAM, when there were sufficient numbers of cells to counteract the ROS in PAM. To asses this hypothesis, we next examined whether stronger PAM that contained higher levels of ROS could inhibit the proliferation of EOC cells even when seeded at a high density.
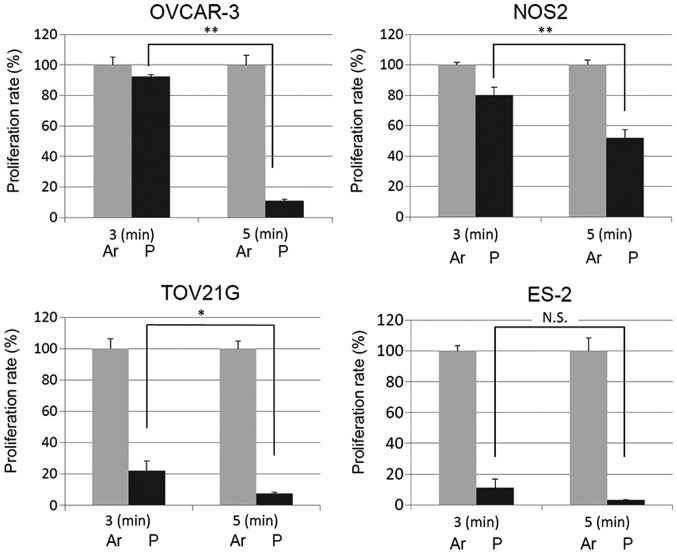
We seeded each EOC cell line at 2.0×10⁴ in 96-well plates not influenced by PAM-3. On the following day, the medium was replaced with PAM-5. After another 24-h incubation, we assessed the cell proliferation rate according to the cell viability assay and compared it with that of the cells treated with PAM-3. As expected, the cell proliferation was further inhibited by PAM-5 while it was not inhibited by PAM-3 (Fig. 4). These results indicate that sufficient ROS in PAM was important for PAM to inhibit cell proliferation.
Figure 4.
Cell viability is decreased by stronger PAM. OVCAR-3 and NOS2 cells were seeded at 2.0×10⁴ in 96-well plates which were not influenced by PAM-3 and treated with Ar-AM-5 and NEAPP-AM-5. The cell viability was measured 24 h after treatment by the Aqueous One Solution Cell Proliferation Assay kit. Error bars represent SD. *P<0.05, **P<0.01. N.S., not significant,
Sensitivity to PAM is also affected by cell morphological characteristics
The differences in the gradient of the PIR graphs among these 4 cell lines may reflect the fact that the sensitivity of cells to PAM varies according to the type of cell line. To identify the factors responsible for this variation in susceptibility, we first focused on the relationships among apoptosis induced by PAM, cell localization, and the morphological characteristics of these four EOC cell lines. Since we hypothesized that the intrinsic redox system of cells acts protectively against ROS in PAM, the localization and distribution of cells were also important for cell survival as well as the number of cells.
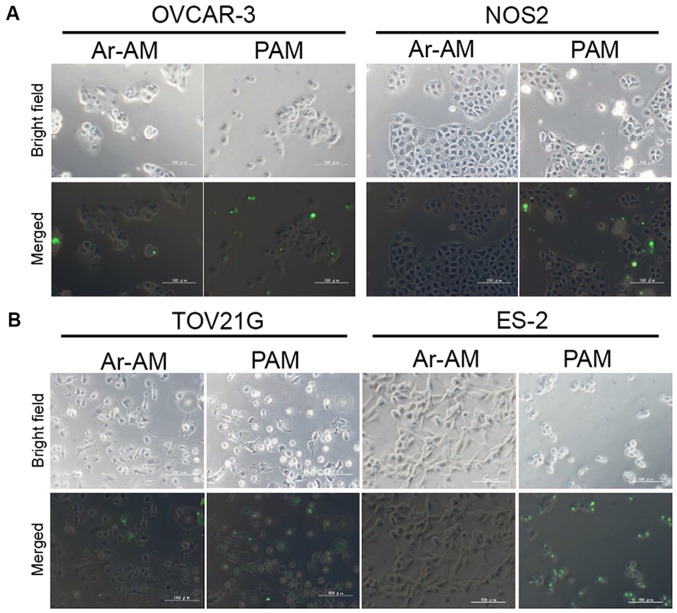
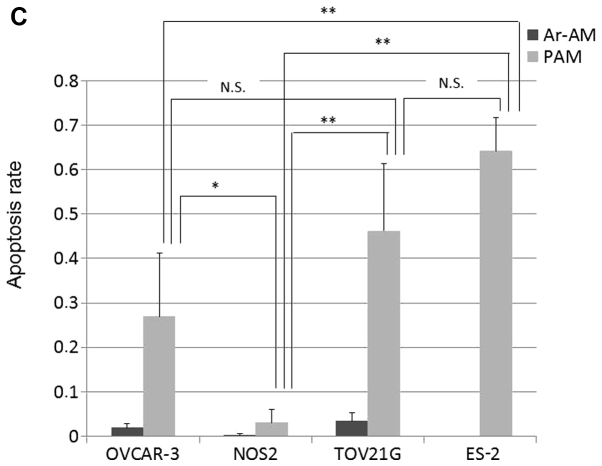
Firstly, to assess the apoptosis and its localization, we performed a TUNEL assay in the four EOC cell lines. In OVCAR-3 and NOS2 cells, TUNEL-positive cells were sporadically and limitedly observed at the edge of a cluster of cells while the central cells survived (Fig. 5A). These two cell lines showed an epithelial morphology that was polygonal in shape with more regular dimensions, and organized into closely adherent sheets. On the contrary, in the TOV21G and ES-2 cells, apoptosis was observed uniformly in all cells loosely aggregated with each other (Fig. 5B). The quantitative analysis of the results of cell apoptosis is shown in Fig. 5C. Quantitative analysis of the TUNEL images indicated that the apoptotic rate in the ES-2 cell line was significantly increased compared to those in the OVCAR-3 and NOS2 cells in addition to the locational difference in apoptotic cells between these cell lines. The number of apoptotic cells in the TOV21G cells was also significantly increased compared to that in the NOS2 cells. Although there was no statistical difference between the OVCAR3 and TOV21G cells, the location of apoptotic cells was clearly different.
Figure 5.
TUNEL assay. OVCAR-3, NOS2, TOV21G, and ES-2 cells were treated with PAM-3 or Ar-AM-3 as a control. After a 24-h incubation, the cells were fixed and the TUNEL assay was performed using an In Situ Cell Detection kit. Representative TUNEL stained images of OVCAR-3 and NOS2 (A), and TOV21G and ES-2 cells (B). (C) Bar graph of the apoptotic rate (n=4). Error bars represent SD. *P<0.05, **P<0.01. N.S., not significant.
Morphological characteristics of the four ovarian cancer cell lines
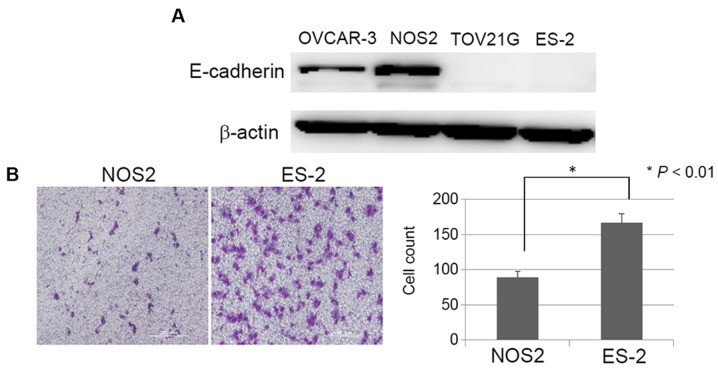
It is well-known that during cancer progression, epithelial cells often acquire mesenchymal features. These steps are accompanied by changes in morphology from an epithelioid or cobblestone appearance to a fibroblastic form. As shown in Fig. 5B, TOv21G and ES-2 cells which displayed high-level sensitivity to PAM showed a fibroblast-like (mesenchymal) appearance and were more likely to come apart and be invasive, while OVCAR-3 and NOS2 cells showed an epithelial morphology. We hypothesized that cells with fibroblastic morphology/scattered growth pattern bring many surfaces into contact with PAM, thus the cytotoxic effect of PAM may be more efficient in such mesenchymal cells. To confirm the relationship between this morphological difference and PAM susceptibility, we confirmed the basal expression of the epithelial marker E-cadherin in these four EOC cell lines. As shown in Fig. 6A, high expression of E-cadherin was noted in OVCAR-3 and NOS2 cells compared with that in the TOV21G and ES-2 cells. The results were consistent with the morphological features of the epithelioid appearance. Furthermore, we examined the basal motile potential of ES-2 cells compared to NOS2 cells with a migration assay. The capacity of the ES-2 cells to migrate was significantly greater than that of the NOS2 cells (Fig. 6B; P<0.01). These results suggest that the aggregation of many cells may act advantageously with respect to cell survival in the presence of ROS, and lead to the hypothesis that PAM can inhibit cell growth more effectively in mesenchymal than epithelial cells.
Figure 6.
Morphological characteristics of the four ovarian cancer cell lines. (A) Basal expression levels of E-cadherin in the OVCAR-3, NOS3, TOV21G, and ES-2 cells. (B) Migration ability of NOS2 and ES-2 cells. The capacity of ES-2 cells to migrate was significantly greater than that of the NOS2 cells (data represent the mean ± SD. *P<0.01).
PAM sensitization induced by mesenchymal morphological change using TGF-β1
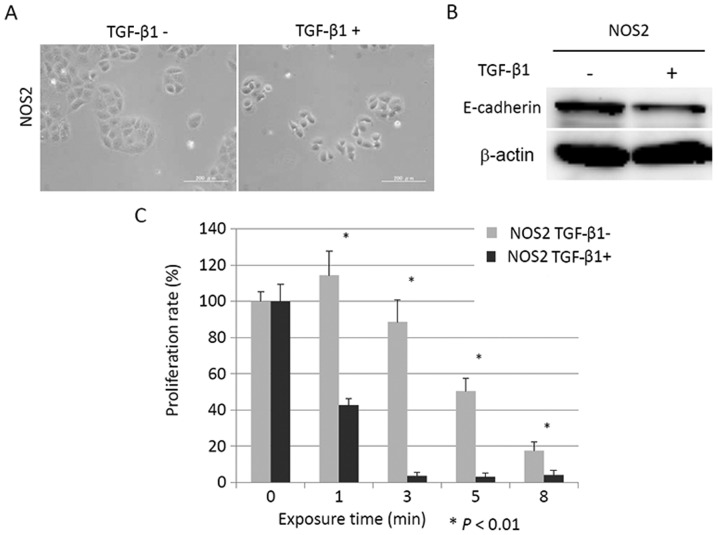
To validate the aforementioned hypothesis, we next examined whether or not induction of a mesenchymal phenotype in EOC cells could sensitize cancer cells to PAM. TGF-β signaling was shown to promote epithelial-mesenchymal transition (EMT) in which cells acquire mesenchymal features and single-cell migration of mammary tumor cells (21). We used TGF-β1 as an inducer of mesenchymal change. We used NOS2 cells which were induced to mesenchymal morphology by stimulation with TGF-β1 and examined the proliferation rate after PAM treatment. Firstly, we assessed the cell morphology and expression of E-cadherin, and we confirmed the presence of EMT in the NOS2 cells induced by TGF-β1. NOS2 cells stimulated by TGF-β1 showed a mesenchymal morphology and reduced E-cadherin expression in comparison with cells which were incubated without TGF-β1 (Fig. 7A and B). Next, after incubation with or without TGF-β1 for 96 h, NOS2 cells were seeded in 96-well plates at a density of 1×10⁴/well in 100 µl. On the following day, the cells were treated with PAM-0, -1, -3, -5, and -8 for 24 h and assessed by a cell viability assay. As shown in Fig. 7C, the proliferation rate decreased by ~96% after PAM-3 in NOS2 cells that had been stimulated by TGF-β1, while in these cells incubated without TGF-β1 the proliferation was inhibited by 13% after PAM-3 treatment (P<0.01). These results provide supporting evidence that mesenchymal cells are more sensitive to PAM than cells which have epithelial characteristics.
Figure 7.
Effect of PAM on the growth of NOS2 cells treated with TGF-β1. (A) Microscopy images of NOS2 cells stimulated with or without recombinant human TGF-β1 at 10 ng/ml for 96 h. (B) Effect of TGFF-β1 on expression of E-cadherin in NOS2 cells. The levels of E-cadherin expression are shown in the top panel. The bottom panel shows the western blotting for β-actin as a loading control. (C) NOS2 cells which were exposed to TGF-β1 at 10 ng/ml for 96 h were treated with PAM-1, -3, -5, and -8 and Ar-AM-1, -3, -5, and -8 for 24 h, and the cell proliferation rate was assessed using the MTS assay. *P<0.01 by Student's t-test compared to the control.
Discussion
Apoptosis is characterized by a well-orchestrated mechanism inducing cells to undergo self-regulation and programmed cell death, and its initiation is a key mechanism in cancer treatment. Several reports have provided clear evidence that plasma-mediated cell death is elicited by inducing apoptosis (6,22). Furthermore, some of these reports indicated that indirect plasma therapy also exhibits an effect comparable to direct plasma treatment against cancer growth (19). In spite of the accumulation of evidence that plasma treatment effectively inhibits cancer growth, the mechanisms underlying this effect remain to be elucidated. Moreover, in some studies of plasma treatment applied to cancer, its efficiency for inducing apoptosis varies depending on the cell species and experimental conditions. In this investigation, we investigated what causes these differences using four ovarian cancer cell lines while modifying experimental conditions.
It has been suggested that plasma induces apoptosis in cells through ROS generated by plasma, leading to peroxidation of the cell lipid double membrane and the subsequent elevation of intrinsic ROS (7,14). Cancer cells may be more vulnerable to ROS-generating agents, because they generate more intrinsic ROS than normal cells due to their high metabolic activity (15). However, recent studies suggest that cancer cells vary in the sensitivity to plasma treatment according to the type of cell and treatment situation (17,23). Panngom et al assessed the different sensitivities to plasma using 6 different cell lines, and reported that plasma induces apoptosis in cancer cell lines to various degrees depending on the type of cancer (24). Furthermore, Tanaka et al showed that the effect of indirect plasma decreased as the number of cells increased using glioma cells (12). In this study, we demonstrated that the cell density and morphological characteristics had a marked impact on cell sensitivity to PAM. Every cell possesses various redox defense systems against intrinsic and extrinsic oxidative stress. Plasma efficacy was suggested to be affected by these types of intrinsic redox substances. If the cell number relative to ROS which are contained in PAM increases, the amount of intrinsic redox substance will also increase, leading to an improved survival rate of cancer cells and the effect of plasma is expected to be limited. In this study, the proliferation rate of cancer cells seeded at the density whose proliferation was less markedly inhibited by PAM-3, was completely reduced by PAM-5, supporting the aforementioned hypothesis.
Furthermore, we focused on the relationship between cell morphology and PAM sensitivity, and found that cells which express less E-cadherin may be more sensitive to PAM. Additionally, inducing mesenchymal morphologic change by TGF-β1 can sensitize cancer cells to PAM. TGF-β has been shown to be an inducer of epithelial-mesenchymal transition in cancer (25). We used TGF-β1 as an inducer of mesenchymal changes. We hypothesized that cell-cell adhesion acted protectively against PAM as well as the increase in the number of cells because the local balance of ROS versus the intrinsic antioxidant substance of cells may be changed by the aggregating of cells. Interestingly, there is a possibility that plasma therapy is more effective against cells with a more mesenchymal phenotype which have lost E-cadherin expression. Cancer cells that have undergone epithelial-mesenchymal transition (EMT) acquire aggressive malignant properties and exhibit resistance to chemotherapy or radiotherapy (23). Plasma therapy is expected to also exert a cytotoxic effect against these metastatic or resistant cancer cells which cannot be controlled with conventional therapies. In fact, we previously demonstrated that PAM inhibited tumor growth in a xenograft mouse model using chemoresistant ovarian cancer cells established in our institute (10). Of course, other factors may affect the sensitivity to plasma, and the relevant molecular mechanisms in this setting are poorly understood. Yet, plasma therapy may be a new and powerful strategy for the prevention or treatment of metastatic ovarian cancer. Further investigation is warranted to elucidate the mechanisms of this promising alternative for cancer treatment.
Abbreviations
- NEAPP
nonequilibrium atmospheric pressure plasma
- EOC
epithelial ovarian cancer
- PAM
plasma-activated medium
- ROS
reactive oxygen species
References
- 1.Kong MG, Kroesen G, Morfill G, Nosenko T, Shimizu T, van Dijk J, Zimmermann JL. Plasma medicine: An introductory review. New J Phys. 2009;11(115012) doi: 10.1088/1367-2630/11/11/115012. [DOI] [Google Scholar]
- 2.Gweon B, Kim DB, Moon SY, Choe W. Escherichia coli deactivation study controlling the atmospheric pressure plasma discharge conditions. Curr Appl Phys. 2009;9:625–628. doi: 10.1016/j.cap.2008.06.001. [DOI] [Google Scholar]
- 3.Teixeira HS, Marin C, Witek L, Freitas A, Jr, Silva NR, Lilin T, Tovar N, Janal MN, Coelho PG. Assessment of a chair-side argon-based non-thermal plasma treatment on the surface characteristics and integration of dental implants with textured surfaces. J Mech Behav Biomed Mater. 2012;9:45–49. doi: 10.1016/j.jmbbm.2012.01.012. [DOI] [PubMed] [Google Scholar]
- 4.Bergler W, Huber K, Hammerschmitt N, Hörmann K. Tonsillectomy with argon plasma coagulation (APC): Evaluation of pain and hemorrhage. Laryngoscope. 2001;111:1423–1429. doi: 10.1097/00005537-200108000-00019. [DOI] [PubMed] [Google Scholar]
- 5.Kalghatgi S, Friedman G, Fridman A, Clyne AM. Endothelial cell proliferation is enhanced by low dose non-thermal plasma through fibroblast growth factor-2 release. Ann Biomed Eng. 2010;38:748–757. doi: 10.1007/s10439-009-9868-x. [DOI] [PubMed] [Google Scholar]
- 6.Ishaq M, Evans MM, Ostrikov KK. Effect of atmospheric gas plasmas on cancer cell signaling. Int J Cancer. 2014;134:1517–1528. doi: 10.1002/ijc.28323. [DOI] [PubMed] [Google Scholar]
- 7.Vandamme M, Robert E, Lerondel S, Sarron V, Ries D, Dozias S, Sobilo J, Gosset D, Kieda C, Legrain B, et al. ROS implication in a new antitumor strategy based on non-thermal plasma. Int J Cancer. 2012;130:2185–2194. doi: 10.1002/ijc.26252. [DOI] [PubMed] [Google Scholar]
- 8.Fridman G, Shereshevsky A, Jost MM, Brooks AD, Fridman A, Gutsol A, Vasilets V, Friedman G. Floating electrode dielectric barrier discharge plasma in air promoting apoptotic behavior in melanoma skin cancer cell lines. Plasma Chem Plasma Process. 2007;27:163–176. doi: 10.1007/s11090-007-9048-4. [DOI] [Google Scholar]
- 9.Brullé L, Vandamme M, Riès D, Martel E, Robert E, Lerondel S, Trichet V, Richard S, Pouvesle JM, Le Pape A. Effects of a non thermal plasma treatment alone or in combination with gemcitabine in a MIA PaCa2-luc orthotopic pancreatic carcinoma model. PLoS One. 2012;7:e52653. doi: 10.1371/journal.pone.0052653. [DOI] [PMC free article] [PubMed] [Google Scholar]
- 10.Utsumi F, Kajiyama H, Nakamura K, Tanaka H, Mizuno M, Ishikawa K, Kondo H, Kano H, Hori M, Kikkawa F. Effect of indirect nonequilibrium atmospheric pressure plasma on anti-proliferative activity against chronic chemo-resistant ovarian cancer cells in vitro and in vivo. PloS One. 2013;8:e81576. doi: 10.1371/journal.pone.0081576. [DOI] [PMC free article] [PubMed] [Google Scholar]
- 11.Iseki S, Nakamura K, Hayashi M, Tanaka H, Kondo H, Kajiyama H, Kano H, Kikkawa F, Hori M. Selective killing of ovarian cancer cells through induction of apoptosis by nonequilibrium atmospheric pressure plasma. Appl Phys Lett. 2012;100(113702) doi: 10.1063/1.3694928. [DOI] [Google Scholar]
- 12.Tanaka H, Mizuno M, Ishikawa K, Nakamura K, Kajiyama H, Kano H, Kikkawa F, Hori M. Plasma-activated medium selectively kills glioblastoma brain tumor cells by down-regulating a survival signaling molecule, AKT kinase. Plasma Med. 2011;1:265–277. doi: 10.1615/PlasmaMed.2012006275. [DOI] [Google Scholar]
- 13.Utsumi F, Kajiyama H, Nakamura K, Tanaka H, Hori M, Kikkawa F. Selective cytotoxicity of indirect nonequilibrium atmospheric pressure plasma against ovarian clear-cell carcinoma. SpringerPlus. 2014;3(398) doi: 10.1186/2193-1801-3-398. [DOI] [PMC free article] [PubMed] [Google Scholar]
- 14.Yan X, Xiong Z, Zou F, Zhao S, Lu X, Yang G, He G, Ostrikov KK. Plasma-induced death of HepG2 cancer cells: Intracellular effects of reactive species. Plasma Process Polym. 2012;9:59–66. doi: 10.1002/ppap.201100031. [DOI] [Google Scholar]
- 15.Schumacker PT. Reactive oxygen species in cancer cells: live by the sword, die by the sword. Cancer Cell. 2006;10:175–176. doi: 10.1016/j.ccr.2006.08.015. [DOI] [PubMed] [Google Scholar]
- 16.Ishimoto T, Nagano O, Yae T, Tamada M, Motohara T, Oshima H, Oshima M, Ikeda T, Asaba R, Yagi H, et al. CD44 variant regulates redox status in cancer cells by stabilizing the xCT subunit of system xc(−) and thereby promotes tumor growth. Cancer Cell. 2011;19:387–400. doi: 10.1016/j.ccr.2011.01.038. [DOI] [PubMed] [Google Scholar]
- 17.Ryu YH, Kim YH, Lee JY, Shim GB, Uhm HS, Park G, Choi EH. Effects of background fluid on the efficiency of inactivating yeast with non-thermal atmospheric pressure plasma. PloS One. 2013;8:e66231. doi: 10.1371/journal.pone.0066231. [DOI] [PMC free article] [PubMed] [Google Scholar]
- 18.De Geyter N, Morent R. Nonthermal plasma sterilization of living and nonliving surfaces. Annu Rev Biomed Eng. 2012;14:255–274. doi: 10.1146/annurev-bioeng-071811-150110. [DOI] [PubMed] [Google Scholar]
- 19.Kalghatgi S, Kelly CM, Cerchar E, Torabi B, Alekseev O, Fridman A, Friedman G, Azizkhan-Clifford J. Effects of non-thermal plasma on mammalian cells. PLoS One. 2011;6:e16270. doi: 10.1371/journal.pone.0016270. [DOI] [PMC free article] [PubMed] [Google Scholar]
- 20.Kajiyama H, Shibata K, Terauchi M, Yamashita M, Ino K, Nawa A, Kikkawa F. Chemoresistance to paclitaxel induces epithelial-mesenchymal transition and enhances metastatic potential for epithelial ovarian carcinoma cells. Int J Oncol. 2007;31:277–283. [PubMed] [Google Scholar]
- 21.Giampieri S, Manning C, Hooper S, Jones L, Hill CS, Sahai E. Localized and reversible TGFbeta signalling switches breast cancer cells from cohesive to single cell motility. Nat Cell Biol. 2009;11:1287–1296. doi: 10.1038/ncb1973. [DOI] [PMC free article] [PubMed] [Google Scholar]
- 22.Yan X, Zou F, Zhao S, Lu XP, He G, Xiong Z, Xiong Q, Zhao Q, Deng P, Huang J, et al. On the mechanism of plasma inducing cell apoptosis. IEEE Trans Plasma Sci. 2012;38:2451–2457. doi: 10.1109/TPS.2010.2056393. [DOI] [Google Scholar]
- 23.Haertel B, Volkmann F, von Woedtke T, Lindequist U. Differential sensitivity of lymphocyte subpopulations to non-thermal atmospheric-pressure plasma. Immunobiology. 2012;217:628–633. doi: 10.1016/j.imbio.2011.10.017. [DOI] [PubMed] [Google Scholar]
- 24.Panngom K, Baik KY, Ryu YH, Uhm HS, Choi EH. Differential responses of cancer cell lines to non-thermal plasma from dielectric barrier discharge. Curr Appl Phys. 2013;13:S6–S11. doi: 10.1016/j.cap.2012.12.025. [DOI] [Google Scholar]
- 25.Xu J, Lamouille S, Derynck R. TGF-beta-induced epithelial to mesenchymal transition. Cell Res. 2009;19:156–172. doi: 10.1038/cr.2009.5. [DOI] [PMC free article] [PubMed] [Google Scholar]


