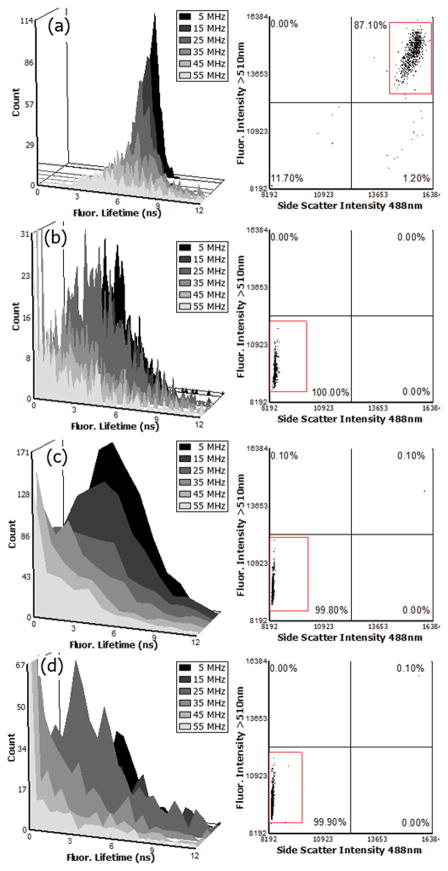
Figure 5.
FACS™ data of ~ 1000 counted fluorescence microspheres (Flow-Check™ (a), Acridine Orange (b), Alexa 488 (c), and fluorescein (d)). The dot plots and histograms were generated using FCS Express® (De Novo Software Inc.) after collecting .fcs files with the lifetime-modified FACSVantage™ flow cytometer. Side scatter vs. fluorescence dot plots show the gated events foreach microsphere population. Histograms of fluorescence lifetimes represent results at 5 MHz and include overlays of the associated odd harmonics (15, 25, 35, 45, and 55 MHz) lifetimes calculated. A marker with a fixed lower and upper bound that ranges across the entire population was used for averaging and calculating the standard deviations (shown in Table 3)

