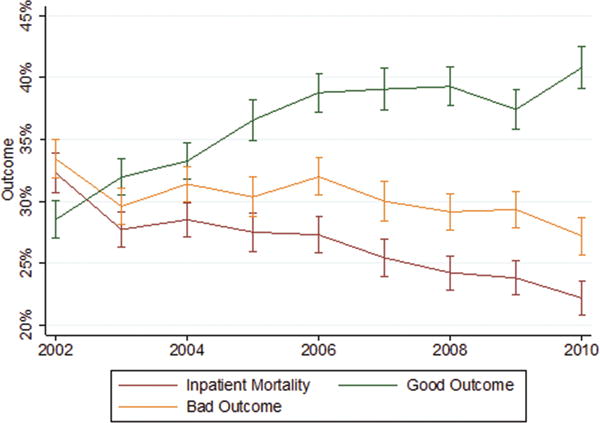
Figure 1.

Outcome trends by time. Proportion of all SAH cases resulting in inpatient mortality (red line), bad outcomes (orange line), or good outcomes/discharge to home (green line) dichotomized by year. Vertical lines represent 95% confidence intervals.
