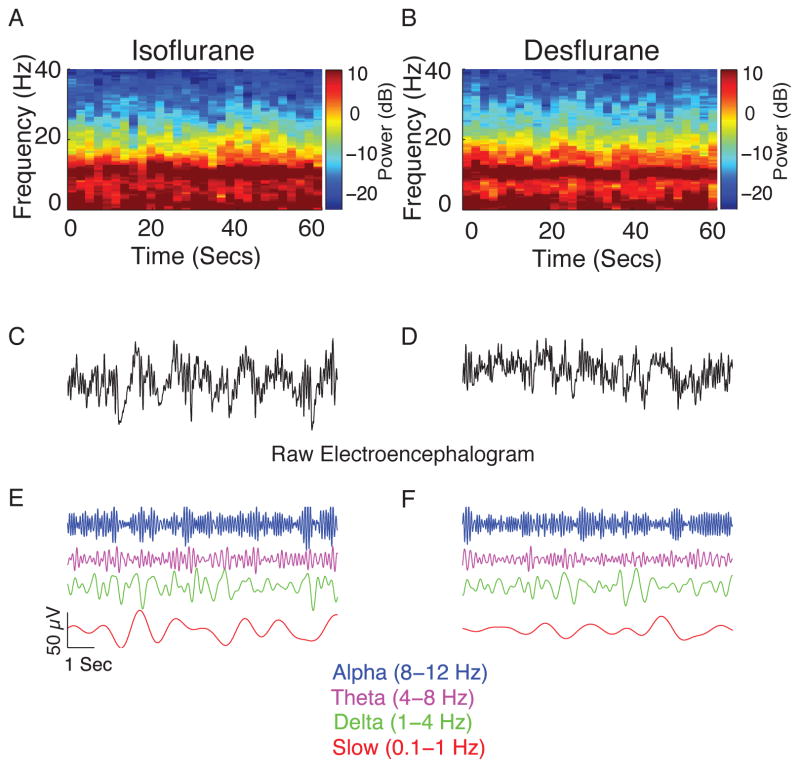
Figure 1.
Representative individual spectrograms and the time domain electroencephalogram data obtained during isoflurane- and desflurane-induced unconsciousness. (A) Spectrogram of a patient who received isoflurane. (B) Spectrogram of a patient who received desflurane. The spectrogram displays the frequency content of signals as they change over time. Frequency is plotted on the y-axis, time is plotted on the x-axis, and the energy or power in the signal is indicated in color. Both spectrograms show power in the slow, theta and alpha frequency bands. (C) Representative 10-s electroencephalogram trace from A. (D) Representative 10-s electroencephalogram trace from B. (E–F) Bandpass-filtered electroencephalogram signals from the raw tracings to more clearly illustrate gross similarities in the electroencephalogram.
dB, decibel; Hz, hertz, Secs, seconds.

