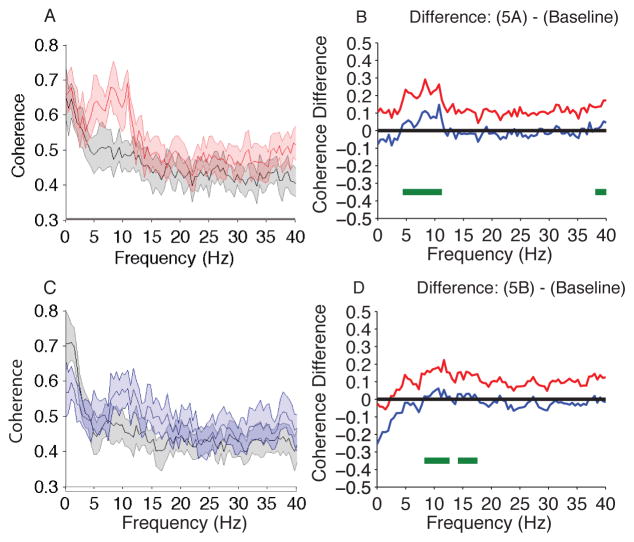
Figure 6.
Coherence comparison (F7–F8) of Isoflurane and Isoflurane/ketamine vs. Baseline. (A) Overlay of median baseline coherence (black), and median isoflurane-induced unconsciousness coherence (red). Bootstrapped median coherences are presented and the shaded regions represent the 95% confidence interval for the uncertainty around each median coherence (n = 10; within subject comparison). (B) The upper (red) and lower (blue) represent the bootstrapped 95% confidence interval bounds for the difference between coherence shown in panel A. During isoflurane-induced unconsciousness, there is significantly increased coherence between 4.39–11.23 Hz and decreased coherence between 38.09–40 Hz. (C) Overlay of median baseline coherence (black), and median isoflurane/ketamine-general anesthesia induced spectrogram (blue). Bootstrapped median coherences are presented and the shaded regions represent the 95% confidence interval for the uncertainty around each median coherence (n = 10; within subject comparison). (D) The upper (red) and lower (blue) represent the bootstrapped 95% confidence interval bounds for the difference between spectra shown in panel C. During isoflurane/ketamine-induced unconsciousness, there is significantly increased coherence between 8.30 – 12.70 Hz, 14.16 – 17.58 Hz.
B, decibel; Hz, hertz; MDDE, modern day derivatives of ether; s, seconds. Horizontal solid green lines represent frequency ranges at which significant difference existed.

