
Figure 1. RES and PST human fecal microbiota and resistomes versus global populations.
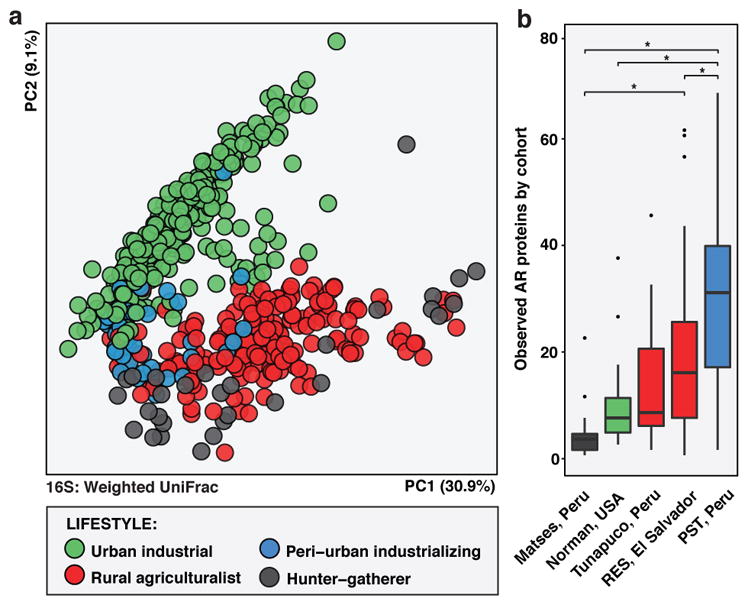
a, PCoA of weighted UniFrac distances between RES (n=60) and PST (n=46) microbiota and published human fecal microbiota from14,19,25 (n=446; see Supplementary Table 14), colored by host lifestyle. Adonis R2=15.4%, p<0.001. b, Number of AR proteins per person in RES (n=42) and PST (n=44) and 25 (n=53; see Supplementary Table 15). Error bars = s.d., center bars = median. *p<0.05, non-parametric Student’s t-tests, Bonferroni correction.