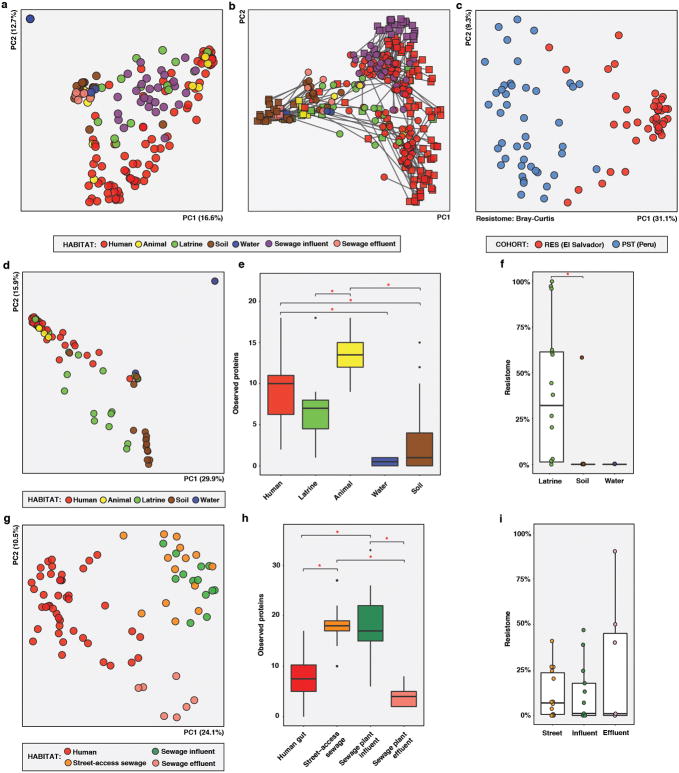
Extended Data Figure 8.
Mobilome analyses.
a, PCoA of Bray-Curtis distances between RES and PST human and environmental resistomes, colored by habitat. (n = 86/10/16/30/4/27/7 for human/animal/latrine/soil/water/pre-treatment sewage/post-treatment sewage) Adonis R2=24.1%, p < 0.001. b, Procrustes transformation of taxonomic composition vs. resistome. Only samples interrogated with both methods were included (n=172). M2=0.493, p<0.001 (172 dimensions, 999 permutations). c, PCoA of Bray-Curtis distances between RES (n = 42) and PST (n = 44) resistomes, colored by cohort. Adonis R2=31.0%, p<0.001. d-f, RES human fecal and environmental microbiota and resistomes, colored by habitat. (n = 42/4/16/30/4 for human/animal/latrine/soil/water). d, PCoA of Bray-Curtis distances between resistomes. Adonis R2=32.0%, p<0.001. e, Observed AR proteins. * p<0.05, non-parametric Student’s t-tests, Bonferroni correction. f, Percentage of latrine, soil, and water resistomes attributable to human feces, as determined by SourceTracker29. * p<0.05, pairwise Wilcox tests, Bonferroni correction. g-i, PST human fecal and sewage microbiota and resistomes, colored by stage. (n = 44/14/13/7 for human/street-access/influent/effluent). g, PCoA of Bray-Curtis distances between resistomes. Adonis R2=34.8%, p<0.001. h, Observed AR proteins. * p<0.05, non-parametric Student’s t-tests, Bonferroni correction. i, Percentage of sewage resistomes attributable to human feces at each sewage treatment stage, as determined by SourceTracker. * p<0.05, pairwise Wilcox tests, Bonferroni correction. Error bars = s.d., center bars = median.

