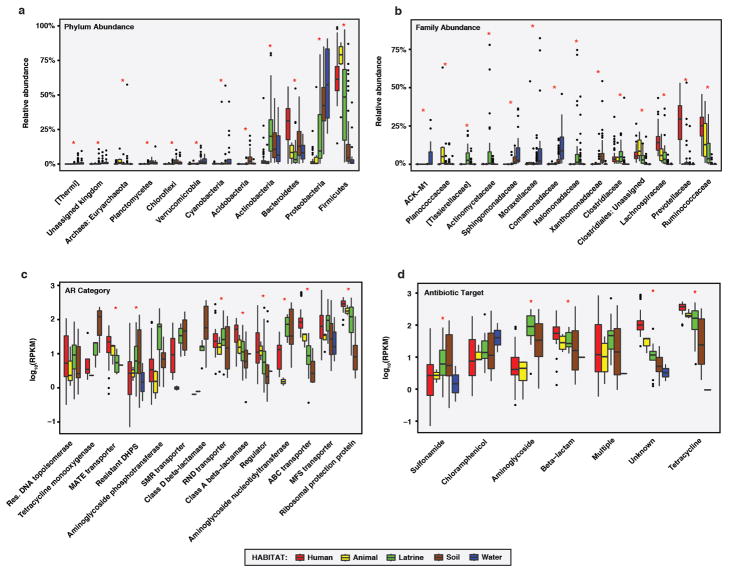
Extended Data Figure 5.
RES human fecal and environmental microbiota and resistomes.
a-b, Relative abundances of microbial a, phyla and b, families in RES microbiota, by habitat. (n = 60/6/36/84/22 for human/animal/latrine/soil/water) Only taxa with a mean relative abundance of ≥1% in one habitat are shown. Taxa are in increasing order of overall mean relative abundance. * p<0.05, Kruskal-Wallis test with Bonferroni correction. c-d, Absolute abundances of AR c, categories and d, antibiotic targets in RES resistomes, by habitat. (n = 42/4/16/30/4 for human/animal/latrine/soil/water) Only categories with a mean RPKM of >10 in one habitat are shown. Categories are in increasing order of overall mean absolute abundance. Abundances are plotted in log10 scale. *p < 0.05, Kruskal-Wallis test with Bonferroni correction. a-d, Error bars = s.d., center bars = median.

