Summary
The National Institutes of Health (NIH) remains the largest source of funding for biomedical research in the United States (U.S.). However, the current tight fiscal climate is creating concerns related to the success in obtaining NIH funding. In this report, we focused on analyzing the trend of new and renewal competing R01 applications, as a measure of the most prevalent NIH funding mechanism that supports many U.S. laboratories and the new science being proposed in the field. We analyzed data regarding R01 applications submitted to the NIH, the National Heart, Lung, and Blood Institute (NHLBI), the Division of Cardiovascular Sciences (DCVS), and the Vascular Biology and Hypertension Branch (VBHB) for fiscal years 2010 through 2014. This comparative analysis at multiple levels allowed us to position the situation of cardiovascular research R01s, from within the “big picture” of NIH funding to looking at specific trends at the level of particular areas of investigation within VBHB. We found that the success rates of competing R01s decreased at all levels: NIH, NHLBI, DCVS, and VBHB. Interestingly, we found that competitive renewal R01 applications remained more successful (about 2 times) than new R01 applications at all levels during this period. By identifying and analyzing some variances to the general trends, we found that some successes may be attributed to effectively utilizing the specific R01 structure that supports team science (i.e., Multiple Principal Investigator, MPI, awards), which enables the active collaborations among investigators with different expertise to pursue together a novel scientific hypothesis.
Keywords: NIH Grant, Federal Funding, Cardiovascular Disease, Hypertension, Vascular Biology
NIH is the largest funding source for biomedical research and development in the world1 and supports research projects, resources, facilities, and personnel costs via various funding mechanisms. NIH investments in extramural research contribute to the overall economy in many ways, through creation of jobs and demand for local services, as well as serve as a foundation for the U.S. biomedical industry. It has been estimated that every $1 of NIH funding generates about $2.21 in local economic growth.2
However, the continuously declining financial support directly available to many U.S. biomedical research laboratories causes a real threat to the overall biomedical research enterprise. The tight fiscal environment also creates serious concerns about the prospects of the ever-increasing number of young investigators being trained, many of whom are considering moving to other countries in order to continue their research.3–5
Several overall trends have likely contributed to the current tight fiscal climate. One main reason is the flat NIH budget, which has been stagnant for more than 10 years, failing to keep pace with inflation (http://www.nih.gov/about/almanac/appropriations/index.htm). Additionally, indirect costs associated with NIH grants have grown continually. For instance, these were estimated to be about one-quarter of NIH’s extramural budget in 2013.6 A recent analysis by the U.S. Government Accountability Office showed that from fiscal year 2003 to 2012 indirect costs increased 16.9 percent (from ~$3.9 billion to $4.6 billion), while direct costs increased 11.7 percent (from ~$10.3 billion to $11.5 billion).7
In the present study, we decided to focus on the success rates and funding trends of competing NIH Research Project Grant (R01), new (type 1) and renewal (types 2 and 9), during the fiscal years 2010 through 2014; supplemental applications (type 3) were excluded from the analysis.
Among the various funding mechanisms for extramural research, the R01 (http://grants.nih.gov/grants/funding/r01.htm) is the oldest and still the most prevalent vehicle for NIH funding of extramural research projects, consisting of about 49% of NIH extramural or 53% of NHLBI extramural budget in 2014. Thus, R01 is a main source of financial support in many biomedical research laboratories throughout the U.S. Although most R01 proposals are investigator-initiated projects, these can be also submitted in response to NIH-initiated Program Announcement (PA) or Requests for Applications (RFA), targeting specific scientific areas. In this report, we considered both the competing new and renewal R01s as an indicator for the new extramural science being supported by the NIH.
We analyzed and compared the trends in R01 funding at the NIH, the National Heart, Lung, and Blood Institute (NHLBI, http://www.nhlbi.nih.gov), the Division of Cardiovascular Sciences (DCVS, http://www.nhlbi.nih.gov/about/org/dcvs), and the Vascular Biology and Hypertension Branch (VBHB) which is within the DCVS.
Our results confirmed a decreased number of R01 awards being funded at all levels and also suggested some potential causes for this decrease. Interestingly, our analysis also revealed some examples that defied the overall somber picture of R01 success trends.
Methods
We obtained the raw data from the publicly accessible NIH Data Book and Funding Facts via the NIH Research Portfolio Online Reporting Tools (RePORT, http://report.nih.gov) as well as from the NIH Office of Extramural Research (OER) within the NIH Office of the Director (OD), that enabled a detailed analysis of trends in grant applications and awards assigned to NHLBI over the period of 2010 through 2014. Data were organized by program division and grant mechanism for NHLBI, DCVS, and VBHB. The NIH grant success rate is defined as “the percentage of reviewed grant applications that receive funding.”8 When calculating the NIH success rates, applications having one or more submissions for the same project in the same fiscal year are counted only once because NIH is historically interested in measuring the success of a project getting funded rather than the success of each individual application. In the present study, we used the combined data both from targeted (NIH-initiated) and untargeted (investigator-initiated) R01 applications unless otherwise stated. Awards made under the American Recovery and Reinvestment Act (ARRA) of 2009 were excluded from the present analysis.
To test whether there is a significant difference in success rates of R01 awards, two-sample proportion tests were used throughout the paper without adjusting for the multiple testing.
Results and Discussion
Declining trends of R01 awards
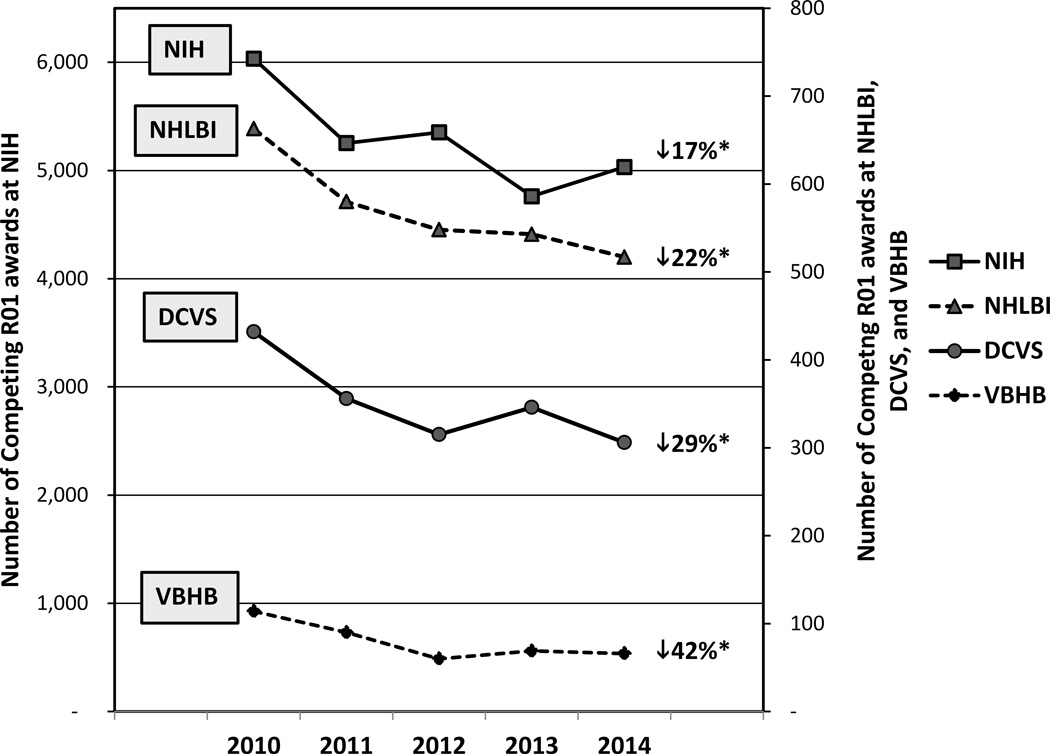
Applications: When comparing 2010 and 2014, the total number of competing R01 applications (new and renewal R01 applications combined) were slightly reduced at NIH (from 27,511 to 27,245; 1% fewer). During the same period, NHLBI received 4% fewer competing R01 applications (from 3,193 to 3,077), while DCVS and VBHB received 7% (from 2,065 to 1,923) and 19% (from 541 to 436) fewer R01 applications, respectively. Awards: Our analysis revealed a decline in the number of competing R01 awards between 2010 and 2014 at all levels (Fig. 1A): NIH (17% decrease), NHLBI (22% decrease), DCVS (29% decrease), and VBHB (42% decrease). Total number of R01 awards: When counting the total number of R01s (all types including competing, non-competing, and supplements) supported by NIH or NHLBI, NIH awarded 12% fewer total R01s (from 26,752 to 23,418) in 2014 as compared to that in 2010, while NHLBI awarded 22% fewer total R01s (from 3,104 to 2,412) in 2014.
Figure 1.
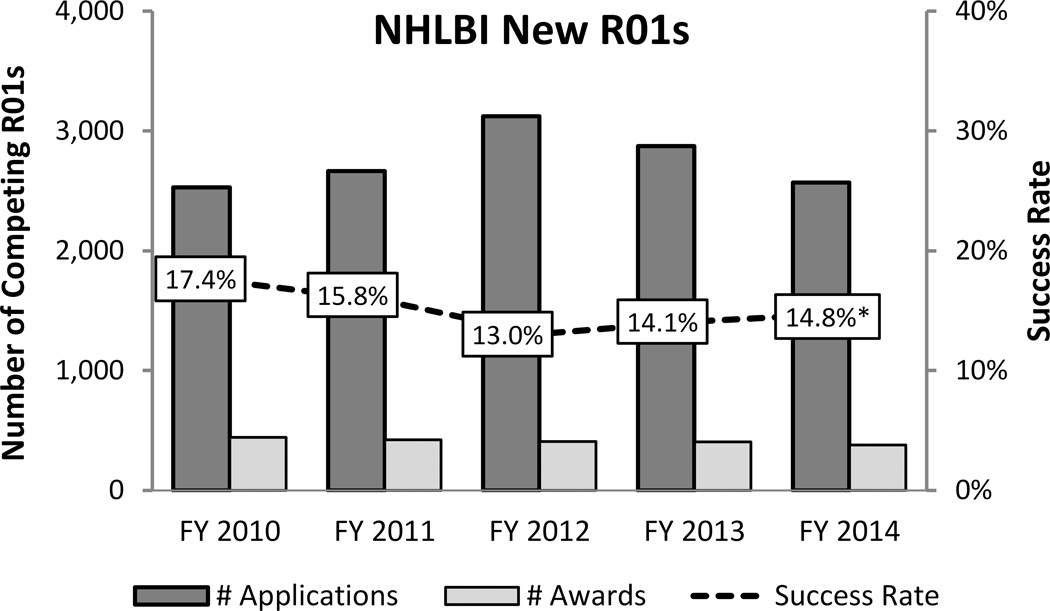
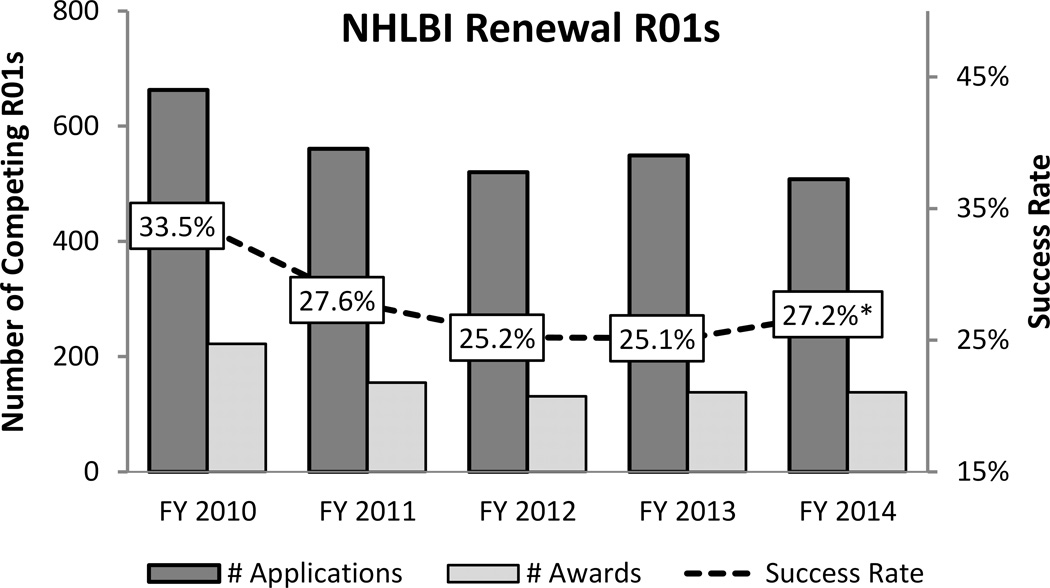
(A) Trends in number of competing (new and renewal) R01 awards in the extramural portfolios of NIH, NHLBI, DCVS, and VBHB during fiscal year (FY) 2010–2014. The declining trend was apparent at all levels. During this 5-year-period, NIH has awarded 17% fewer competing R01s, while NHLBI, DCVS, or VBHB awarded 22%, 29%, or 42% fewer competing R01 awards, respectively. Trends of new (B) and renewal (C) competing R01 success rates at NHLBI during 2010–2014 are shown. Competing renewal R01 applications were consistently more successful (about 2 times) than new R01s. *statistically significant with P-value of <0.05 (two-tailed proportion z-test, comparison between 2010 and 2014). Abbreviations: NHLBI (National Heart, Lung, and Blood Institute), DCVS (Division of Cardiovascular Sciences), and VBHB (Vascular Biology and Hypertension Branch).
Declining trends of R01 success rates
We found a declining trend of overall R01 success rates (average of new and renewal competing R01 applications) across the NIH, with success rates decreasing from 22% in 2010 to 19% in 2014. During the same period, similar trends were also observed at NHLBI (from 21% to 17%), DCVS (21% to 16%), and VBHB (21% to 15%) (Online Figure 1). The same decline trend was also observed in two other divisions of NHLBI, Division of Lung Diseases (from 21% to 19%) and Division of Blood Diseases and Resources (from 19% to 17%). In another analysis, we compared the success rates between targeted and untargeted R01 applications at NHLBI and DCVS and found no statistical difference (Supplementary Table S1). This is consistent with the findings at the NIH level.9 The competing R01 success rate of ESIs (Early Stage Investigators) also declined at NHLBI from 26% in 2010 to 19% in 2014 (P<0.05). An interesting observation during the examined period was that competitive R01 renewal applications remained more successful (about two times) than new R01 applications at all levels: NIH, NHLBI, DCVS, and VBHB (Fig. 1B and C and Supplementary Table S2).
Several factors might have affected the declining trends of R01 success rates, such as flat NIH budget or increased number of applications. Here, we have examined the latter possibility in more detail: i.e., a higher competition due to an increased number of R01 applications submitted to NIH, NHLBI, DCVS, or VBHB over the years. As discussed above, at NIH level, the total number of competing R01 applications received during 2010 and 2014 were very similar (27,511 vs. 27,245). However, when examining the level of various NIH Institutes and Centers (ICs), we found that the number of competing R01 applications assigned to different NIH ICs have varied during this period (Supplementary Table S3); for example, about a half of NIH ICs received fewer applications, and the other half received an increased number of applications. In 2014, several NIH ICs (e.g., NIGMS, NIDDK, NICHD, NEI, NIEHS, and NCCAM) received significantly more competing R01 applications (statistically significant at 5% level) than in 2010. In contrast, NIAID, NIDA, NIAMS, NIDCR, and FIC received significantly fewer competing R01 applications. NHLBI received fewer R01s (3,193 vs. 3,077), although the difference was not statistically significant. Thus, it is possible that some investigators may have been actively diversifying their research portfolios to increase their chance of getting funded from the NIH.
In 2014, VBHB received significantly fewer competing R01 applications as compared to 2010 (19% fewer applications, P<0.05). During the same period, the success rate of the VBHB awards was comparable to those of NHLBI and DCVS awards (Online Figure 1). Potential reasons for the decreased number of VBHB R01 applications in 2014 include (i) a reduced number of applications submitted by each investigator in the field of vascular biology and hypertension or (ii) a reduced number of investigators who stay in the field. A recent analysis showed that the number of NIH competing RPG (Research Project Grants) applications submitted by each investigator is relatively constant: about 0.6 applications per investigator per year since 2006.10 As for the latter possibility, VBHB investigators might have shifted their research focus within the mission of other NIH ICs. In this regard, NHLBI shares several areas of scientific interest with NIDDK, NICHD, and NINDS (e.g., diabetes, obesity, kidney disease, cerebrovascular disease, and some pregnancy-related diseases). We have further explored this possibility by examining the grant submission behavior of the investigators who submitted competing R01 applications to VBHB in 2010. We found that in 2010, 83% of all competing R01 applications submitted by the VBHB cohort investigators (i.e., whose R01 applications were assigned to VBHB in 2010) were assigned to NHLBI; the remaining 17% R01 applications submitted by these investigators were assigned to other NIH ICs. However, in 2014 a significantly smaller proportion (59%) of all competing R01 applications submitted by the same VBHB investigators was assigned to NHLBI, while the remaining 41% were assigned to other ICs.
Counter trends revealed by geographical mapping of R01 funding
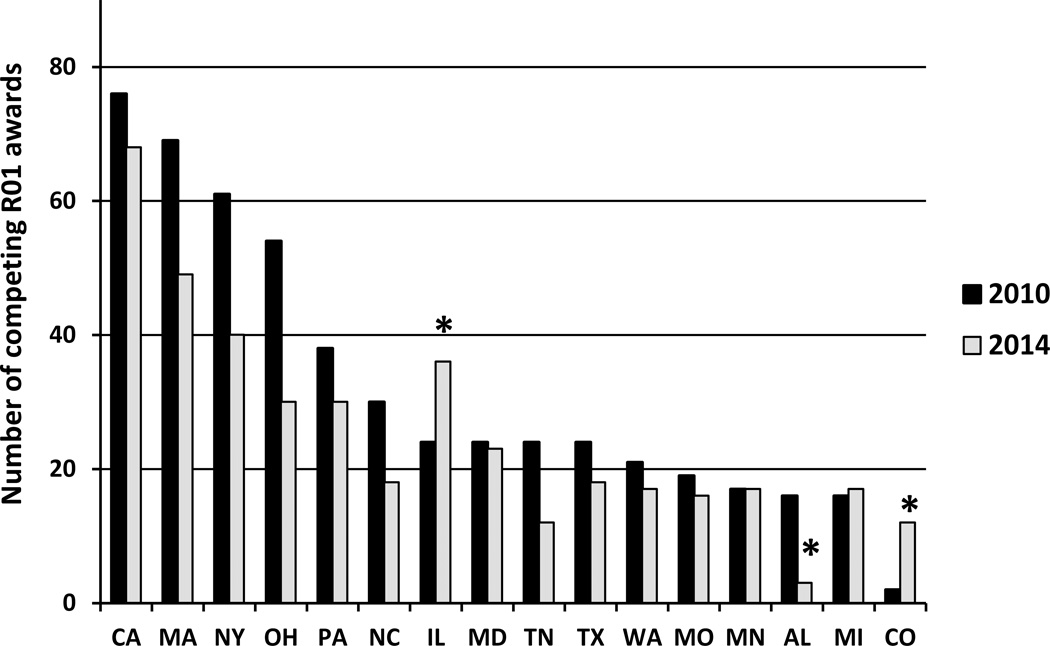
To get a more detailed picture of the distribution of R01 funding, we analyzed trends by states in the U.S. (Supplementary Table S4). The phenomenon of receiving fewer competing NHLBI R01 awards in 2014 compared to 2010 was apparent in all U.S. states with a few notable exceptions. There were nine U.S. states that received more NHLBI competing R01 awards in 2014 than in 2010. Among these, two states (Illinois and Colorado) stood out with 50% and 500% increase, respectively (Fig. 2A).
Figure 2.
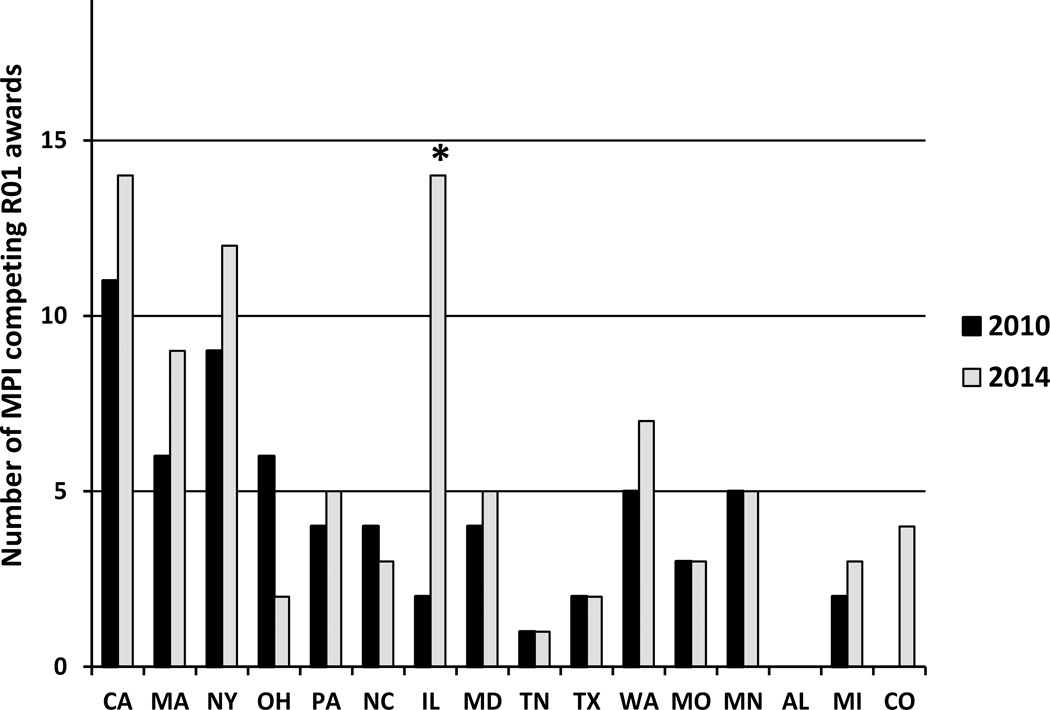
(A) Trends and distribution of competing R01 awards in top 15 states that received most NHLBI R01 awards in 2010 (black). The Colorado State is also included because of dramatic increase in 2014. As a comparison, the number of competing R01 awards in the same states in 2014 are shown (gray). Illinois (IL) and Colorado (CO) are distinct in receiving significantly more R01s in 2014 compared to 2010. (B) Changes in number of MPI (Multiple Principal Investigator) competitive R01 awards in top 15 states that received most NHLBI R01 awards in 2010 and the State of Colorado. Note the highly increased number of MPI awards in Illinois and Colorado in 2014 as compared to those in 2010. *statistically significant, p<0.05 (two-tailed proportion z-test).
The trend of the top 15 states that received most NHLBI R01 awards in 2010 (representing 77% of NHLBI competing R01 awards in 2010) is illustrated in Figure 2A. The State of Illinois received a total of 24 NHLBI competing R01 awards in 2010, but the award number increased to 36 in 2014. Most awards were distributed among three major institutions: Northwestern, University of Chicago, and University of Illinois at Chicago. In terms of NHLBI divisional distribution of 2014 R01s to Illinois institutions, DCVS funded the most competing R01 awards (20 R01s) followed by Division of Lung Diseases (12 R01s) and Division of Blood Diseases and Resources (4 R01s).
The State of Colorado also made significant advances in NHLBI R01 funding; the state ranked 33rd in 2010, receiving only two competing R01 awards, but the state received 12 NHLBI R01 awards in 2014 (Fig. 2A). Two major institutions were active in receiving NHLBI R01s: University of Colorado at Denver and National Jewish Health. In terms of NHLBI divisional distribution, Division of Lung Diseases funded the most competing R01 awards (8 R01s) followed by DCVS (2 R01s) and Division of Blood Diseases and Resources (2 R01s) in 2014.
Success of NIH-funded team science seems to be on the rise
We thought the finding of an opposite trend in receiving R01 funding during the current tight fiscal environment warranted a closer look, and so we have further investigated the characteristics of the awards in these two states. We found no apparent concentration of awards to specific investigators or through focus on a specific disease. Rather, we have noted that the proportion of MPI (Multiple Principal Investigator) awards, which use the R01 mechanism, was distinctly increased in these two states (Fig. 2B). NIH implemented the MPI policy in 2007 in order to maximize the potential of team science efforts and to encourage collaboration among investigators to address a complex scientific problem and to promote transdisciplinary research (http://grants.nih.gov/grants/multi_pi/). A recent analysis shows that the number of MPI applications at NIH continues to increase, and there is a statistically significant difference in award rate between single investigator versus MPI award rates in 2013, which favors the trend of MPI awards.11 In this study, we compared the success rates between targeted and untargeted MPI R01 applications at NHLBI in 2010 and 2014 (Supplementary Table S5). Although there is no statistical difference between these two groups, targeted MPI R01 applications tend to have better success rates than untargeted MPI R01s. Fig. 2B shows that many states received equal or more MPI R01 awards from NHLBI in 2014 as compared to 2010 despite overall fewer number of R01 awards in 2014, meaning that the proportion of MPI awards has increased. Some states (i.e., OH and NC), in contrast, showed reduced number of MPI R01 awards in 2014, and interestingly, their ranking in receiving total NHLBI competing R01 awards decreased since 2010. This new trend of increased MPI R01s is consistent with the goal of NIH MPI policy. Although it is complex to measure the scientific impact of a research project, it has recently been demonstrated that interdisciplinary research on a relatively proximal range of fields can have a positive effect in knowledge creation and more successful research.12 Recently, Hall et al.13 have reported that the effort of National Cancer Institute to support transdisciplinary research can be achieved more effectively via team science rather than solo investigator-initiated R01 awards.
As to the specific trends, the proportion of MPI competing R01 awards at NHLBI increased from 13% to 21%; at DCVS from 11% to 20%; and at VBHB from 7% to 12%, from 2010 to 2014, respectively. Although these findings may encourage investigators to favor MPI applications, investigators might want to carefully consider all the pros and cons of the MPI R01 mechanism, as the MPI structure may not be appropriate for all researchers. A particularly important consideration is relevant for the ESIs; while team science can offer excellent opportunities for gaining research experience and receiving mentoring from established investigators, participating in an MPI award with established investigators will result in losing the ESI status (http://grants.nih.gov/grants/new_investigators/index.htm). As a final note, NHLBI is consistently looking for most effective and efficient ways to support NHLBI-investigators. One such effort has recently resulted in two new programs (R35 Outstanding Investigator Award and Emerging Investigator Award; http://www.nhlbi.nih.gov/research/funding/nhlbi-r35-outstanding-investigator-award-and-emerging-investigator-award-program) to support the research program of NHLBI-funded investigators, rather than a research project, for up to 7 years.
In summary, through the analysis of the NIH and NHLBI competing R01 award trends in 2010 through 2014, the decreased success rates were observed at all levels. Interestingly, some positive counter-trends were observed suggesting that success can be enhanced through the effective use of the specific R01 mechanism that supports team science.
Supplementary Material
Acknowledgments
The authors wish to thank Rosie Giang, Carol Bleakley and Natalie Graham from the Division of Statistical Analysis and Reporting (DSAR), Office of Extramural Research, NIH for providing NHLBI-specific data. We also thank VBHB staff for helpful suggestions and discussions during this study.
Source of Funding
Authors are employees of the NHLBI. No specific funding was allocated for this work.
Footnotes
Conflicts of interest disclosure(s)
There are no conflicts of interest.
References
- 1.Moses H, 3rd, Matheson DH, Cairns-Smith S, George BP, Palisch C, Dorsey ER. The anatomy of medical research: Us and international comparisons. JAMA. 2015;313:174–189. doi: 10.1001/jama.2014.15939. [DOI] [PubMed] [Google Scholar]
- 2.NIH. Impact: Our economy. [Accessed March 30, 2016]; http://www.nih.gov/about/impact/economy.htm [Internet]
- 3.Alberts B, Kirschner MW, Tilghman S, Varmus H. Rescuing us biomedical research from its systemic flaws. Proceedings of the National Academy of Sciences of the United States of America. 2014;111:5773–5777. doi: 10.1073/pnas.1404402111. [DOI] [PMC free article] [PubMed] [Google Scholar]
- 4.ASMB. Unlimited potential, vanishing opportunity. [Accessed March 30, 2016]; http://www.asbmb.org/Advocacy/Publications/UnlimitedPotentialVanishingOpportunity/ [Internet] [Google Scholar]
- 5.Powell K. The future of the postdoc. Nature. 2015;520:144–147. doi: 10.1038/520144a. [DOI] [PubMed] [Google Scholar]
- 6.Ledford H. Indirect costs: Keeping the lights on. Nature. 2014;515:326–329. doi: 10.1038/515326a. [DOI] [PubMed] [Google Scholar]
- 7.Office USGA. Biomedical research: Nih should assess the impact of growth in indirect costs on its mission. [Accessed March 30, 2016]; http://www.gao.gov/products/GAO-13-760 [Internet]
- 8.Rockey S. Rock talk: Comparing success rates, award rates, and funding rates. [Accessed March 30, 2016];2014 http://nexus.od.nih.gov/all/2014/03/05/comparing-success-award-funding-rates/ [Internet]
- 9.NIH. Nih databook: Success rates of new competing applications for targeted and untargeted research. [Accessed March 30, 2016]; http://report.nih.gov/nihdatabook/index.aspx [Internet]
- 10.Rockey S. Rock talk: More on more applications. [Accessed March 30, 2016];2013 http://nexus.od.nih.gov/all/2013/04/26/more-on-more-applicants/ [Internet]
- 11.Rockey S. Rock talk: How do multi-pi applications fare? [Accessed March 30, 2016];2014 http://nexus.od.nih.gov/all/2014/07/11/how-do-multi-pi-applications-fare/ [Internet]
- 12.Yegros-Yegros A, Rafols I, D'Este P. Does interdisciplinary research lead to higher citation impact? The different effect of proximal and distal interdisciplinarity. Plos One. 2015;10 doi: 10.1371/journal.pone.0135095. [DOI] [PMC free article] [PubMed] [Google Scholar]
- 13.Hall KL, Stokols D, Stipelman BA, Vogel AL, Feng A, Masimore B, Morgan G, Moser RP, Marcus SE, Berrigan D. Assessing the value of team science: A study comparing center- and investigator-initiated grants. American journal of preventive medicine. 2012;42:157–163. doi: 10.1016/j.amepre.2011.10.011. [DOI] [PMC free article] [PubMed] [Google Scholar]
Associated Data
This section collects any data citations, data availability statements, or supplementary materials included in this article.


