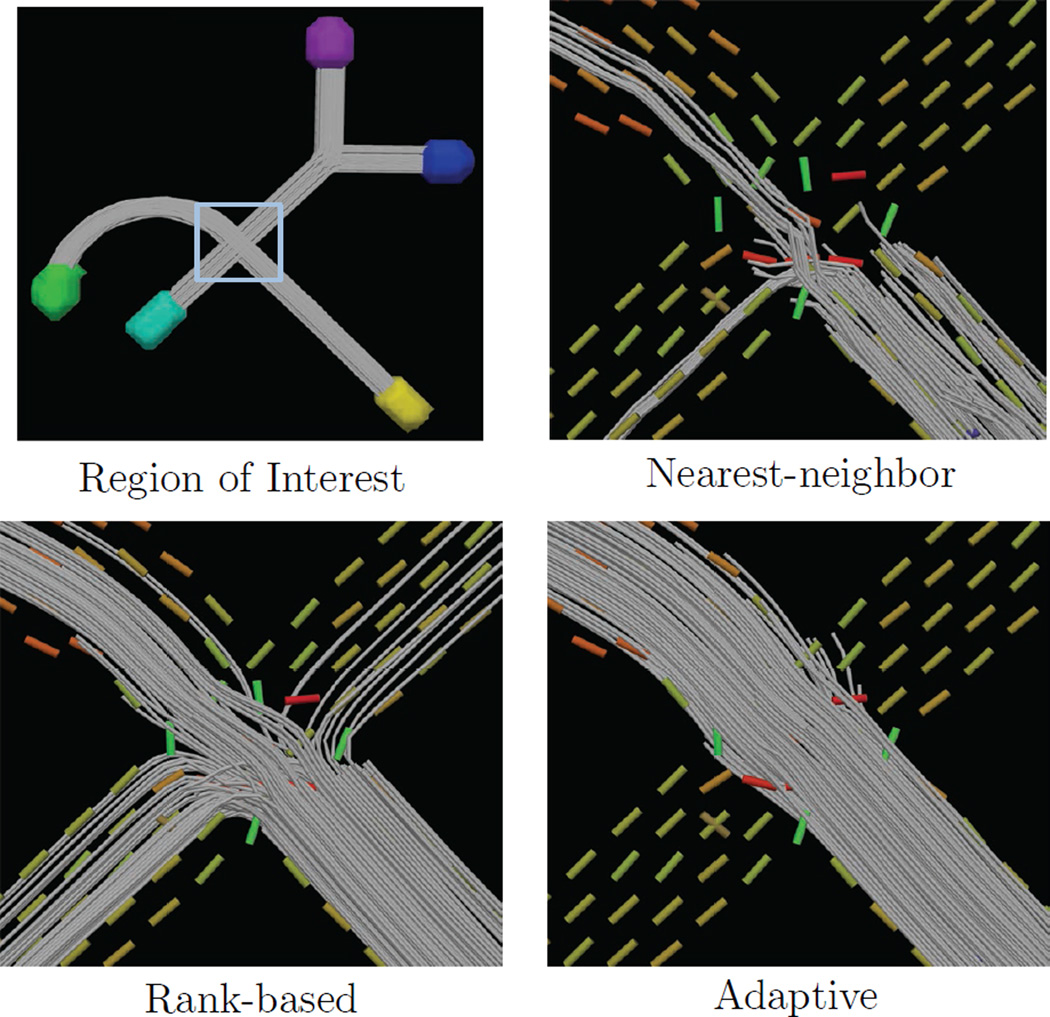
Figure 7.
Results from the second experiment in Sec. 5.3. The first panel shows the phantom and region-of-interest, and the following three panels show tractography results using nearest neighbor interpolation, local-max model selection, and adaptive model selection (Eq. 8). This shows how local-max selection can sometimes introduce “fiber splitting” due to noise (SNR 16.5 shown). Adaptive selection can reduce this effect, resulting in smoother streamline curves and lower orientation and volume fraction errors (see Fig. 8).

