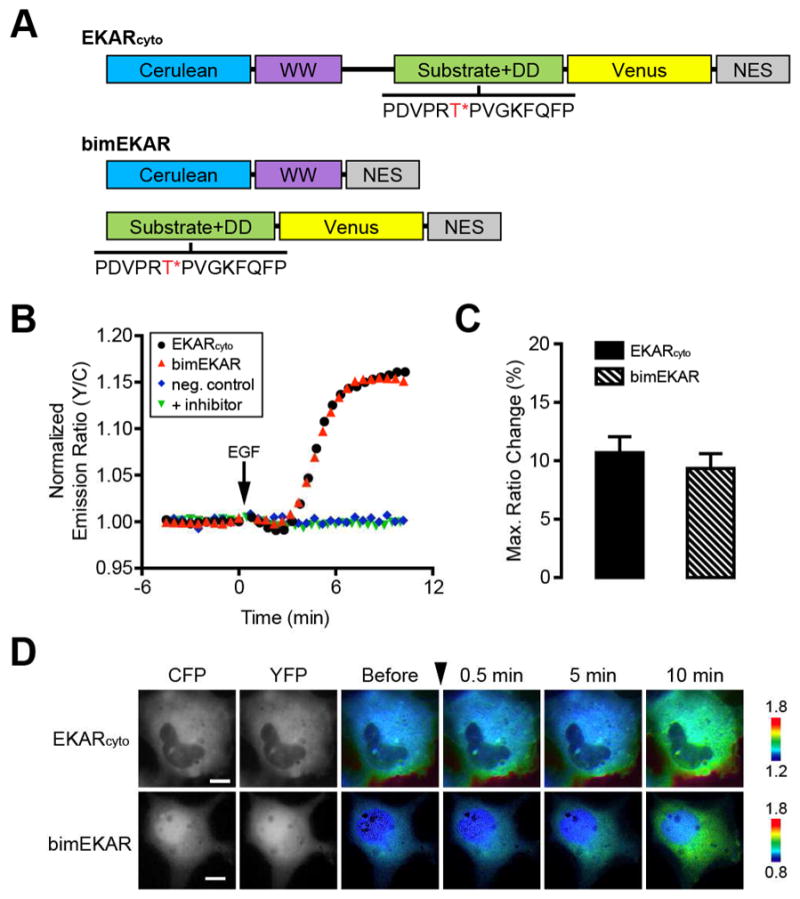
Figure 2.

Development of a bimolecular ERK activity reporter. (A) Schematic diagram of domain structures for EKARcyto and bimEKAR. The ERK substrate/docking domain (DD) sequence is shown with the target threonine (T) residue highlighted in red and marked with an asterisk (*). (B) Representative single-cell traces of Cos7 cells expressing EKARcyto (black curve), bimEKAR (red curve), or a non-phosphorylatable bimEKAR mutant (neg. control; blue curve) treated with 100 ng/mL EGF. “+ inhibitor” (green curve) indicates Cos7 cells expressing bimEKAR that were pretreated for 1 h with 10 μM U0126. Cells were serum starved for 20 min prior to imaging. (C) Summary bar graphs comparing the average maximum responses of EKARcyto and bimEKAR upon EGF stimulation. Data shown represent means ± SEM. (D) Representative pseudocolored images showing the responses of EKARcyto and bimEKAR to 100 ng/mL EGF treatment in Cos7 cells. Warmer colors correspond to increasing FRET ratios. Cyan (CFP) and yellow (YFP) fluorescence images show the cellular distribution of probe fluorescence.
