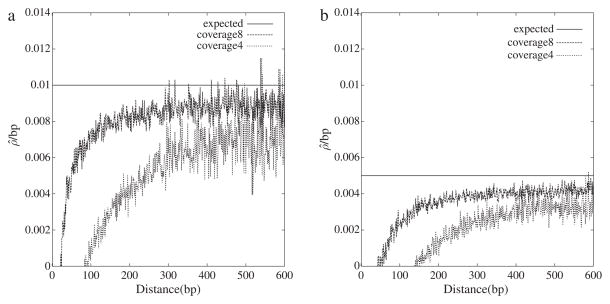
Fig. 2.
The maximum likelihood estimator of the population recombination rate per base pair, ρ̂/bp, as a function of pairwise distance for two coverages. Each graph is based on a single simulated data set consisting of 1000 pairs of 100 kb sequences (contigs) with θ = 0.01 and ρ = 0.01 (a) or ρ = 0.005 (b). This data set was in silico shotgun sequenced to a coverage of four or eight with an error rate of ε = 10−4.

