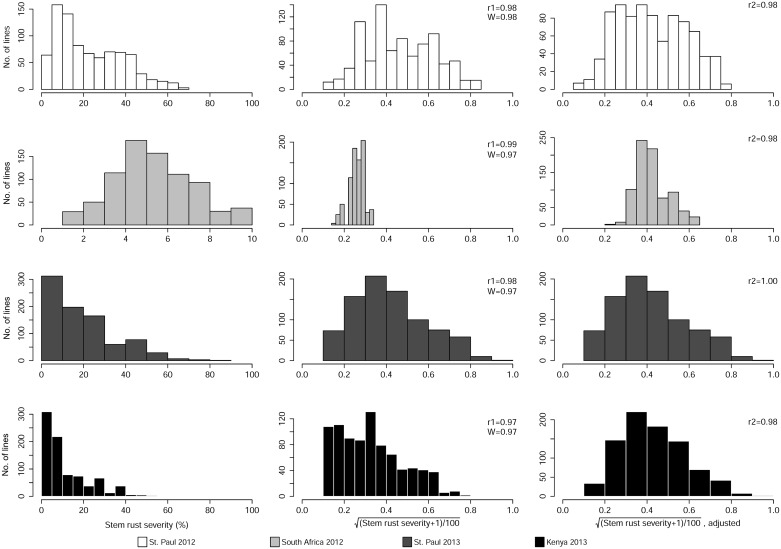
Fig 1. Distributions for disease coefficient of infection (CI) and their respective transformed datasets for stem rust in each of the four environments.
The Pearson’s correlations are represented as follows: “r1” between the coefficient of infection (CI) values and square root transformed data; and “r2” between the square root transformed data and data adjusted for trial differences. “W” represents the Shapiro-Wilk test statistic between the coefficient of infection (CI) values and square root transformed data.

