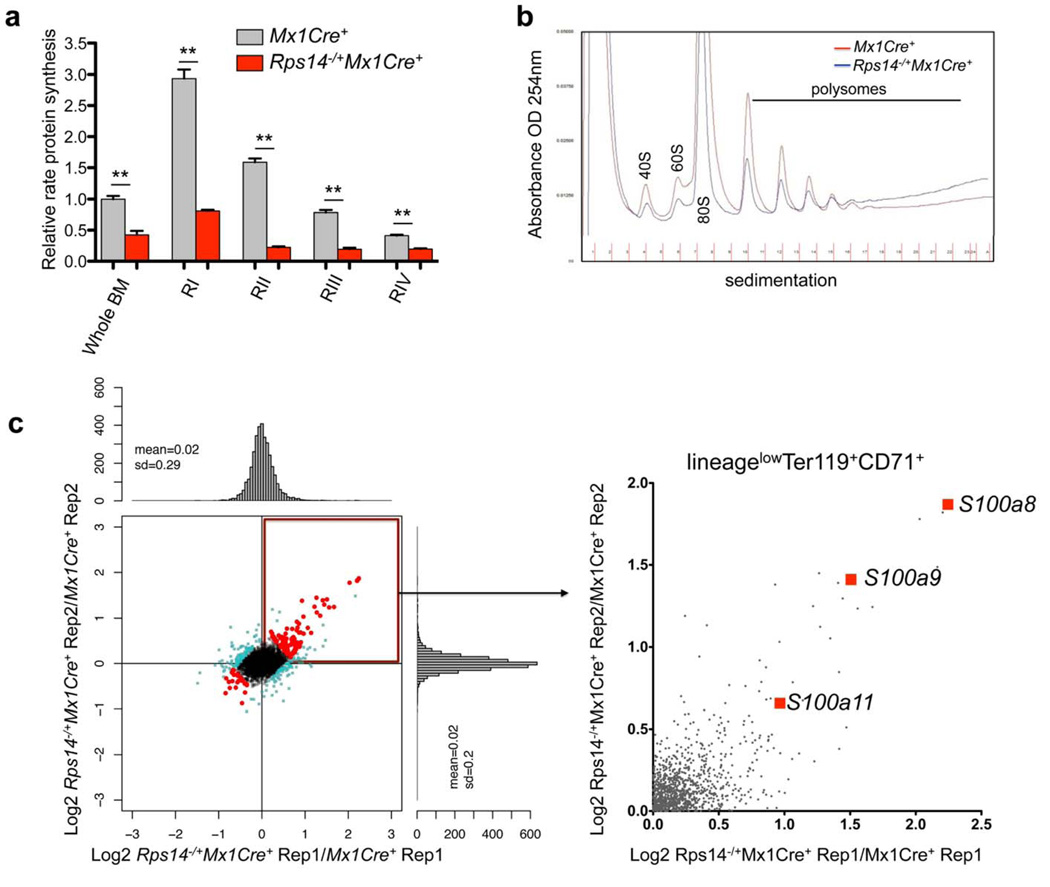
Figure 3. Reduced protein synthesis in Rps14 haploinsufficient cells.
(a) OP-Puro incorporation in bone marrow (BM) cells in vivo 1 h after administration in 20 week old Mx1Cre+ control cells or Rps14−/+Mx1Cre+ cells [(16 weeks after the first injection of poly(I:C)]. Quantification of OP-Puro fluorescence reflecting protein synthesis rate in hematopoietic stem and progenitor cells relative to unfractionated bone marrow. Relative protein synthesis and quantification of OP-Puro fluorescence in erythroid RI-RIV progenitor populations relative to unfractionated bone marrow (mean±SD, n=5; **p<0.001; Unpaired two-sided t-test was applied for statistical analysis). (b) Polysome profiles from sort-purified lineagelowCD71highTer119+ erythroid progenitor cells in Mx1Cre+ control cells or Rps14−/+Mx1Cre+ cells. The x-axis shows the distance along the gradient. The arbitrary Y-axis shows the relative absorbance. Data are representative of 3 independent experiments (each n=3 biological replicates). (c) Proteomic analysis of induced changes in protein expression of Rps14 haploinsufficient sort-purified lineagelowCD71highTer119+ erythroid progenitor cells relative to Mx1Cre+ cells (300µg protein for each technical replicate=4 biological replicates). Log2 ratios and scatter plot for individual proteins for replicate 1 and 2, where each dot represents a unique protein. The upper right quadrant represents proteins that are significantly up-regulated by Rps14 haploinsufficiency in replicate 1 and 2 (Rep 1 and 2) relative to Mx1Cre+ control cells. Detailed statistical methods for the proteomic analysis are described in the methods section.

