
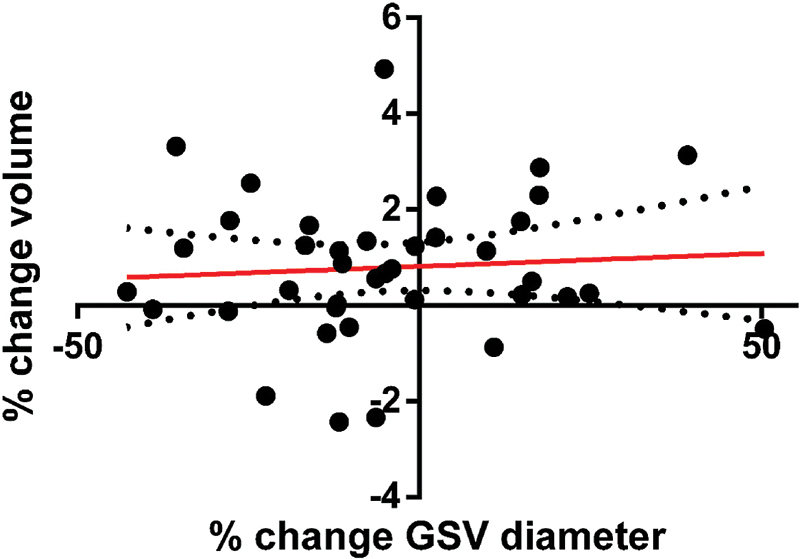
Fig. 2.
Percentage changes in great saphenous vein diameter plotted against percentage changes in leg volume. Line of best fit is shown (r 2 < 0.01) with 95% confidence intervals. GSV, great saphenous vein.
Official websites use .gov
A
.gov website belongs to an official
government organization in the United States.
Secure .gov websites use HTTPS
A lock (
) or https:// means you've safely
connected to the .gov website. Share sensitive
information only on official, secure websites.
Percentage changes in great saphenous vein diameter plotted against percentage changes in leg volume. Line of best fit is shown (r 2 < 0.01) with 95% confidence intervals. GSV, great saphenous vein.