
Figure 5. Decision tree analysis incorporating the LSVR and splenic volume.
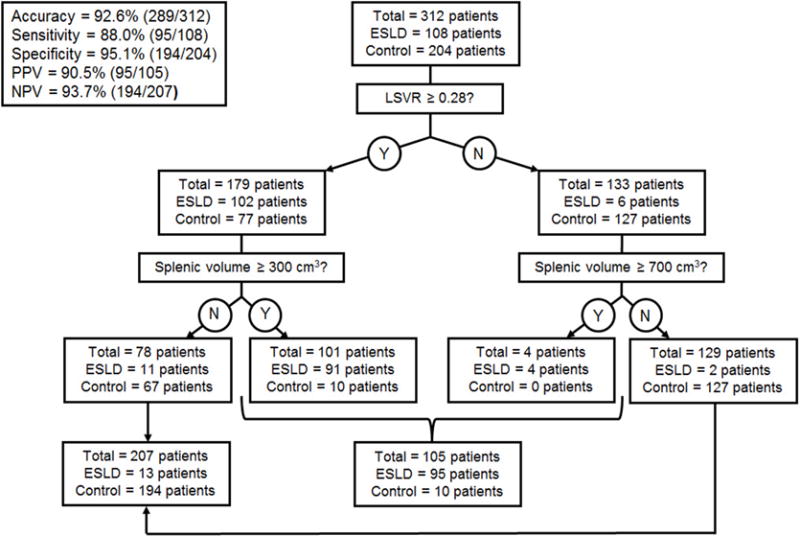
Using the thresholds shown in the diagram, the overall accuracy for cirrhosis was 92.6%. If a splenic volume threshold of 230 cm3 is substituted for 300 cm3 above, the sensitivity and specificity profile shift to 93.5% and 89.7%, respectively.