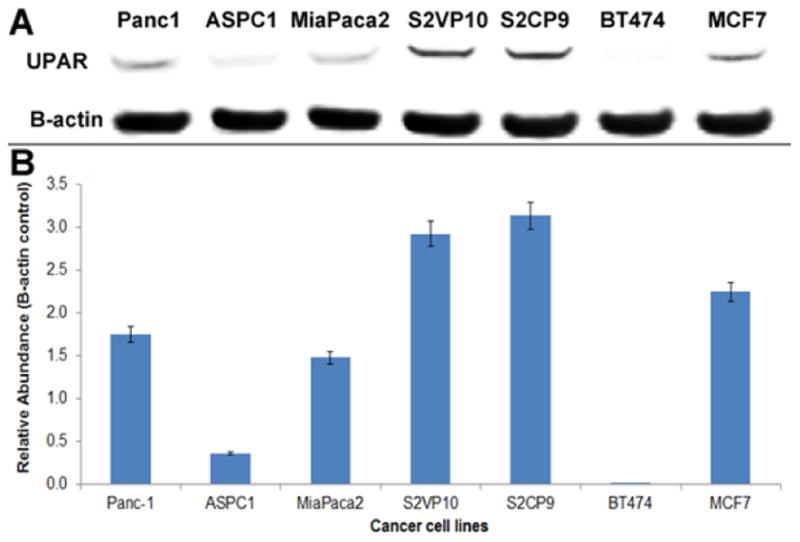
Figure 3.

Western blot analysis of cell lines. A) Western Blot analysis of multiple pancreatic cell lines and two breast cancer cell lines was performed to assess the relative expression levels of UPAR. BT474, a UPAR negative breast cancer cell line, was used as a negative control for UPAR expression. MCF7, a UPAR positive breast cancer cell line, was used as a positive control. B) Dosimetry indicates that S2VP10 and S2CP9 cells express UPAR at the highest levels among those cell lines evaluated.
