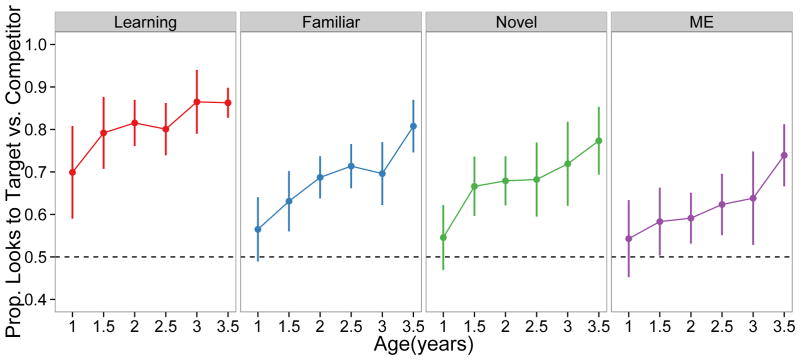
Figure 6.
Proportion of time children fixated the correct target on each trial type in Experiment 1. Children improved on all measures across development. Each dot indicates one half-year age group and each line represents a 95% confidence interval computed by non-parametric bootstrap. A proportion of .5 indicates chance performance.

