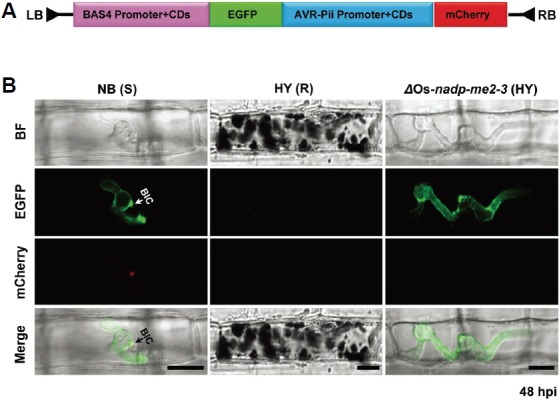
Fig. 4.

Differential regulation of the effectors was visualized using two BAS4 and AVR-Pii-effector expression cassettes. (A) Schematic representation of plasmid pCB1004 containing BAS4:EGFP and AVR-Pii:mCherry as described in the “Materials and Methods”. (B) Expression of BAS4 and AVR-Pii was observed in susceptible NB, where BAS4 appeared uniformly as a bright outline in the invasive hyphae, and AVR-Pii accumulated locally in the BIC (white arrow) at 24-48 hpi. In contrast, expression of BAS4 appeared in invasive hyphae, but AVR-Pii was not detected in the ΔOs-NADP-ME2-3 mutant. In addition, BAS4 and AVR-Pii were not observed in HY, indicating no viable hyphae. BIC, biotrophic interfacial complex; S, susceptible; R, resistant. Scale bars, 10 μm.
