Figure 5.

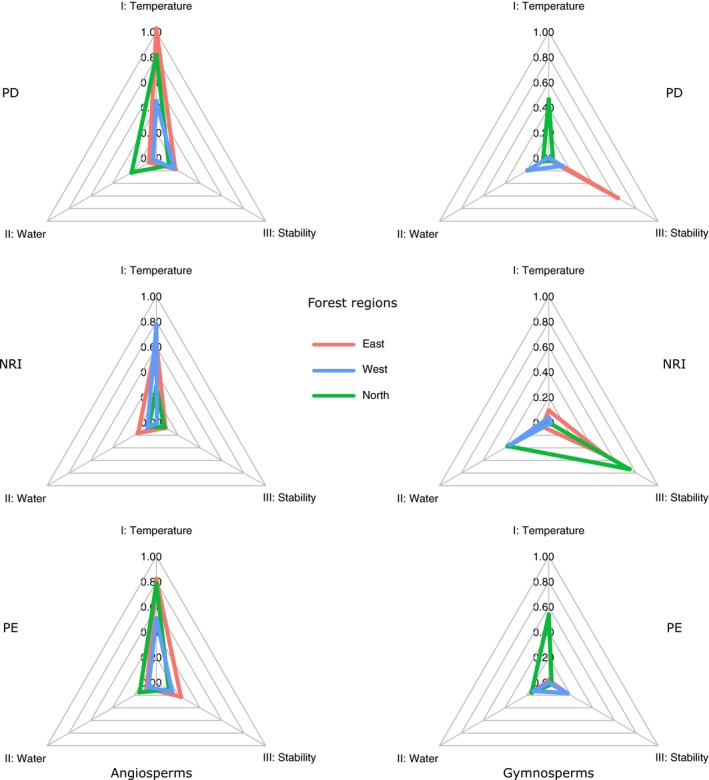
Differences in maximum effect sizes of predictor groups between angiosperms and gymnosperms in the models for the North, West, and East regions. Effect sizes are the magnitude of model‐averaged standardized coefficients. The predictors were grouped as follows: I. Temperature‐related: MAP, TMIN, and TES; II: Water‐related: WBL and PRS; III: Postglacial stability‐related: ACC, VT, and EHET. Angiosperms showed most response to current temperature, while gymnosperms were likely more influenced by postglacial climate stability.
