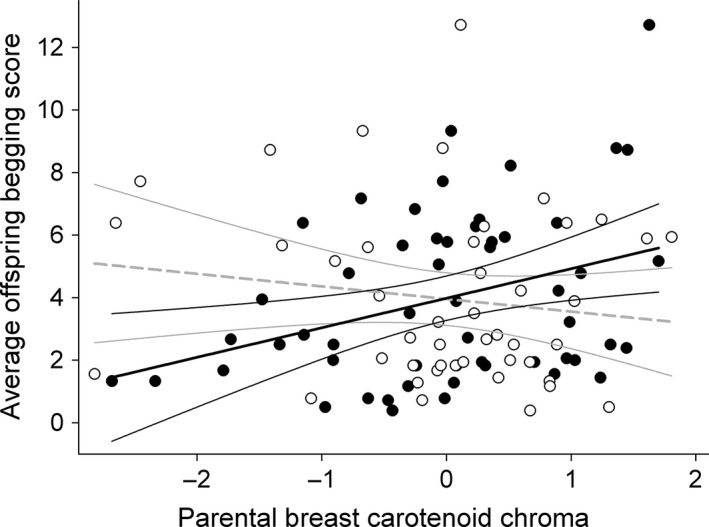
Figure 2.

Begging intensity of genetic chicks plotted against parental breast carotenoid chroma (z‐transformed). Filled circles and significant solid black regression line (with 95% confidence bands) represent mothers. Open circles and nonsignificant striped gray regression fit represent fathers.
