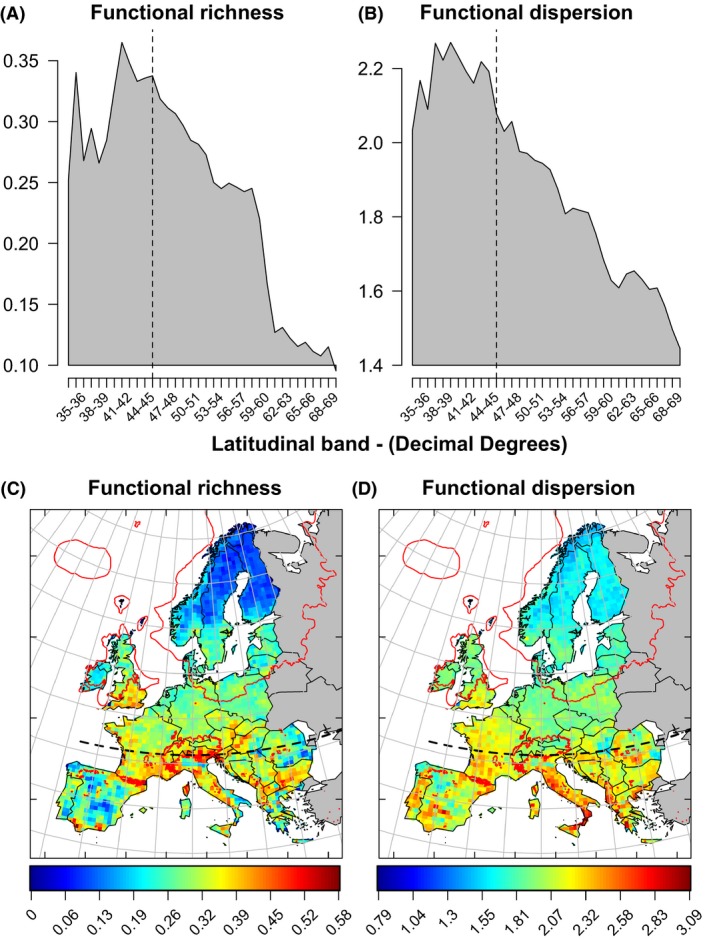
Figure 1.

Functional diversity (FD) of European plants summarized by latitudinal bands (A, B) and for each of the Atlas Flora Europaeae grid cells (C, D). The dashed line in black in all panels represents the maximum northern limit of temperate tree full‐glacial refugia. Red delimited areas showed the maximum ice area present over 21,000 years ago (C, D). Represented values are the FD mean functional richness or dispersion, across the ten estimates calculated using ten distinct imputed trait datasets (see Methods).
