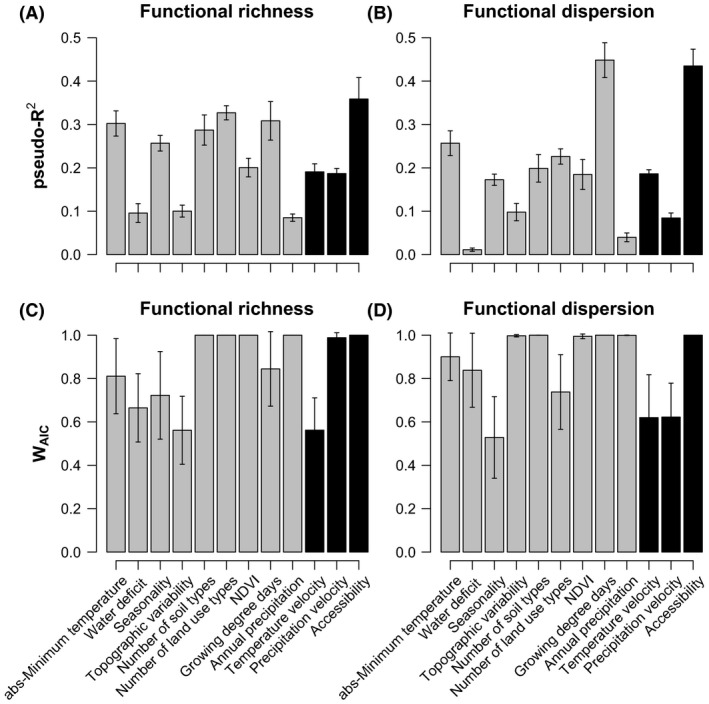
Figure 2.

Explained variance (A, B) and relative support (C, D) of contemporary (gray) and historical (black) environmental predictors associated with realized functional richness and dispersion. The bar height and whiskers show the mean and 95%CI of the explained variance and relative importance score across the ten imputed datasets for each of the 12 evaluated predictors. Explained variance determined as Nagelkerke's (1991) pseudo‐R 2 values from single‐predictor models with a unimodal response (linear + quadratic terms). Relative support (W AIC) determined using Burnham and Anderson (2002) approach, where Akaike weights (w AIC) are summed across all models where the variable of interest was included as a linear or unimodal response. All relations between FD and environmental predictors determined using a spatial autoregressive error (SAR error) modeling approach (see Methods).
