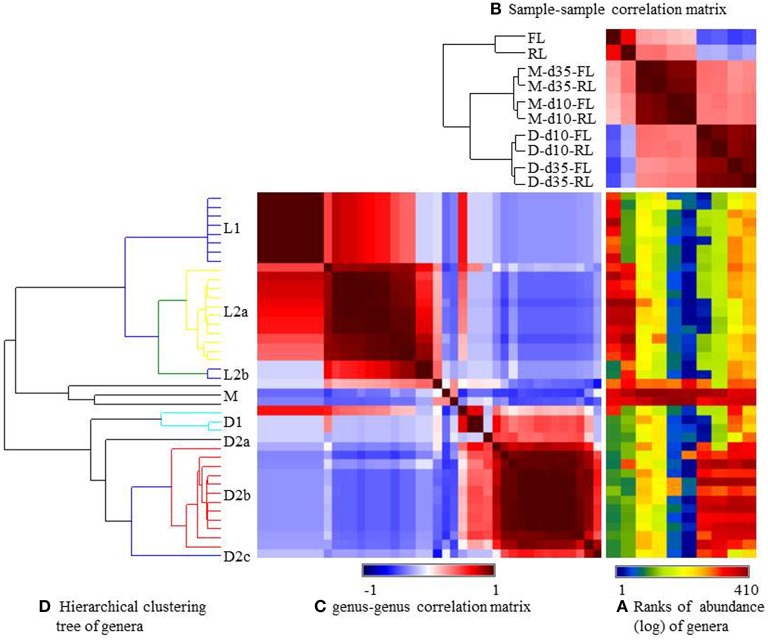
Figure 3.
Generalized association plots for the major genera identified in the 10 datasets. (A) Genus abundance heatmap, (B) The sample-sample correlation map, (C) The genus-genus correlation map, and (D) The hierarchical clustering tree for sorting the genus-genus correlation map in (C). The 10 datasets and the genera were sorted based on corresponding sample-sample correlation and genus-genus correlation, respectively. M, illeal mucosa; D, cecal digesta; d10 and d35, samples collected at 10 and 35 days, respectively, of bird age; FL, fresh litter; RL, reused litter.

