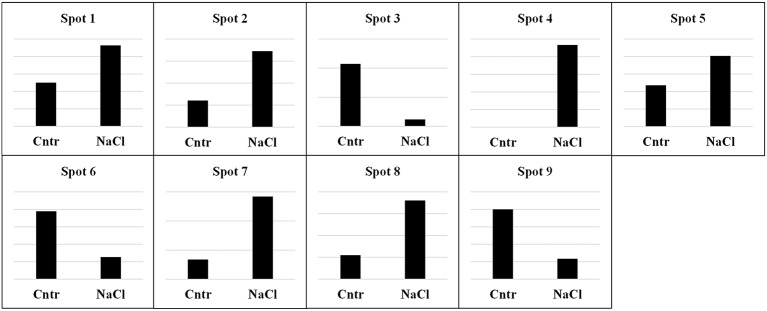
Figure 3.
Relative abundance of individual spots from the albumin/globulin fractions of quinoa seeds harvested from plants grown under control (Cntr) or saline (NaCl) conditions. Spots are numbered as shown in the master gel (Figure 2). Each spot is presented with the value of its relative quantification. The first column indicates the control sample, while the second column indicates the 300 mM NaCl treatment. Scales are different in the Y-axes of each graph because they were optimized to highlight the different intensity of spots between samples. In all cases, the most intense spot was used as reference for calibrating the scale of Y-axes.

