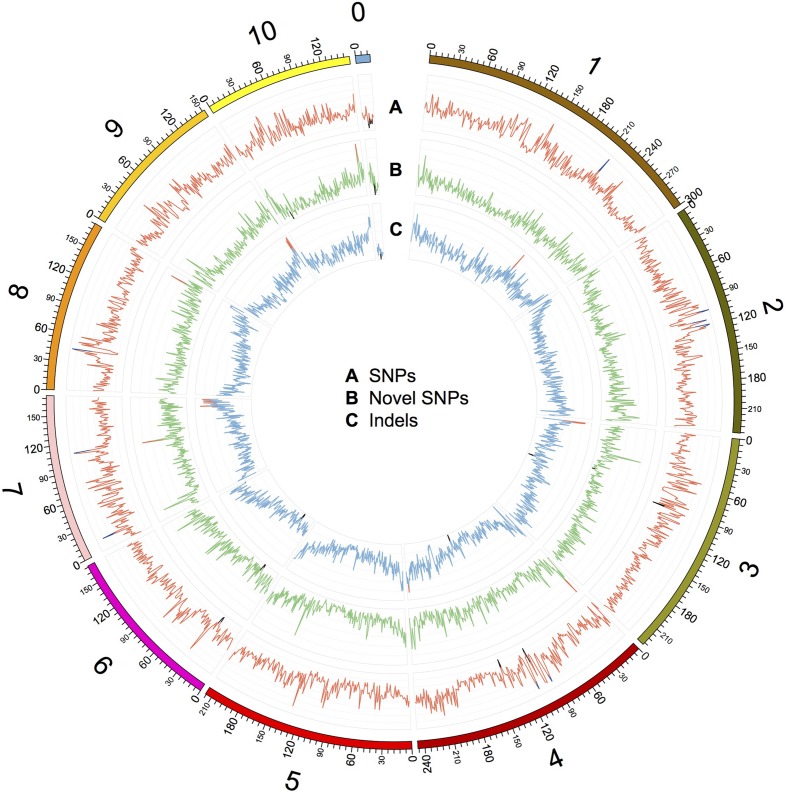
FIGURE 2.
Distribution of SNPs, novel SNPs, and InDels on the chromosomes of Four-row Wax. The outer circle represents the physical distance along each chromosome, split into 1 Mb windows. A, B, and C indicate the density of SNPs, novel SNPs, and InDels, respectively. SNPs and InDels were identified by mapping Four-row Wax reads to the B73 genome, and novel SNPs were identified by comparing Four-row Wax SNPs with HapMap2. A: each grid denotes SNP density of 500/Mb, with line color indicating density >3500/Mb (blue), or <500/Mb (black). B: each grid denotes novel SNP density of 100/Mb, with line color indicating density >500/Mb (red) or <20/Mb (black). C: each grid denotes InDel density of 50/Mb, with line color indicating density >250/Mb (red) or <10/Mb (black). Chromosome 0 denotes sequences that are part of unplaced or unlocalized contigs.

