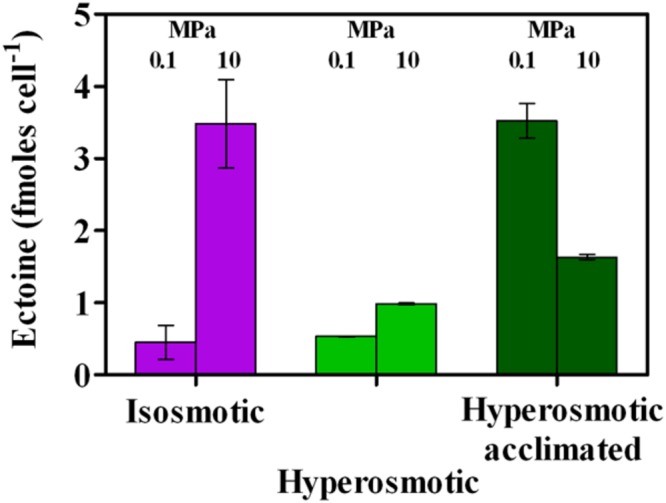
FIGURE 4.

Ectoine production per cell in A. borkumensis SK2 cells subjected to hyperosmotic conditions under different hydrostatic pressures (0.1 or 10 MPa) as compared to standard isosmotic conditions. Keys: isosmosis (purple), hyperosmosis (light green), hyperosmosis acclimated (dark green). Bars indicate 95% confidence intervals.
