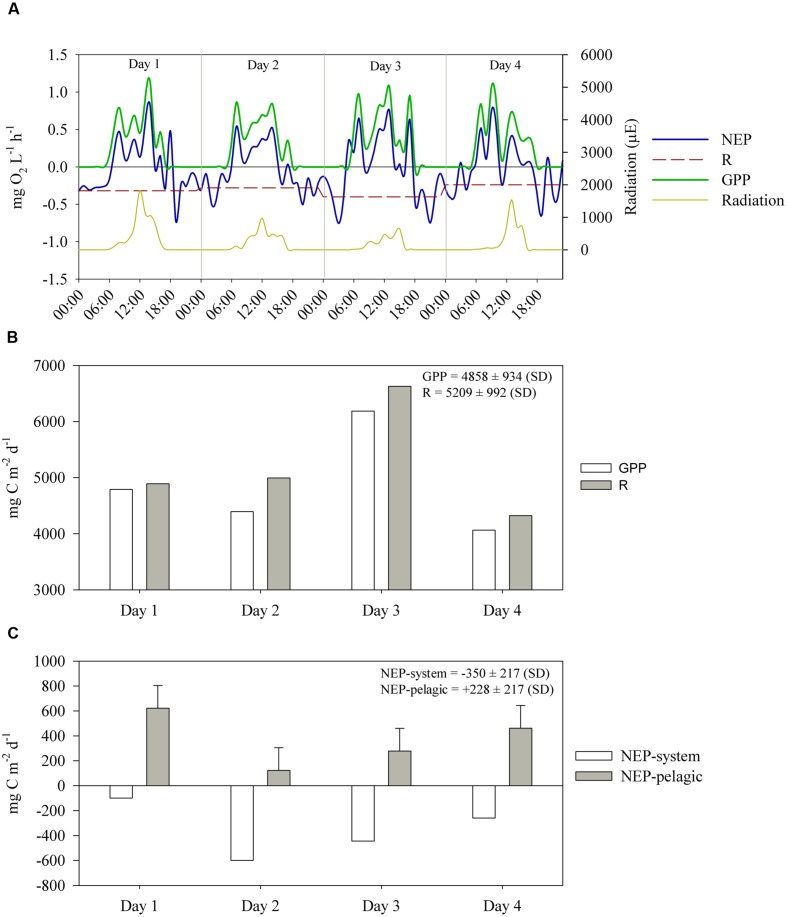
FIGURE 7.
(A) Hourly estimates, in oxygen units, of volumetric gross primary production (GPP), respiration (R) and net ecosystem production (NEP), between July 14 and 17. R is shown as an average of NEP during nighttime on each day. The average R over the 4 days was 0.31 ± 0.07 mg O2 L-1 h-1. (B) Daily estimates, in carbon units, of GPP and R. (C) Daily estimates, in carbon units, of areal NEP-system (i.e., considering sediment respiration) and NEP-pelagic (i.e., excluding sediment respiration, 722 ± 182 mg C m-2 d-1) between July 14 and 17. The whiskers outside NEP-pelagic bars indicate the standard deviation of sediment respiration.

