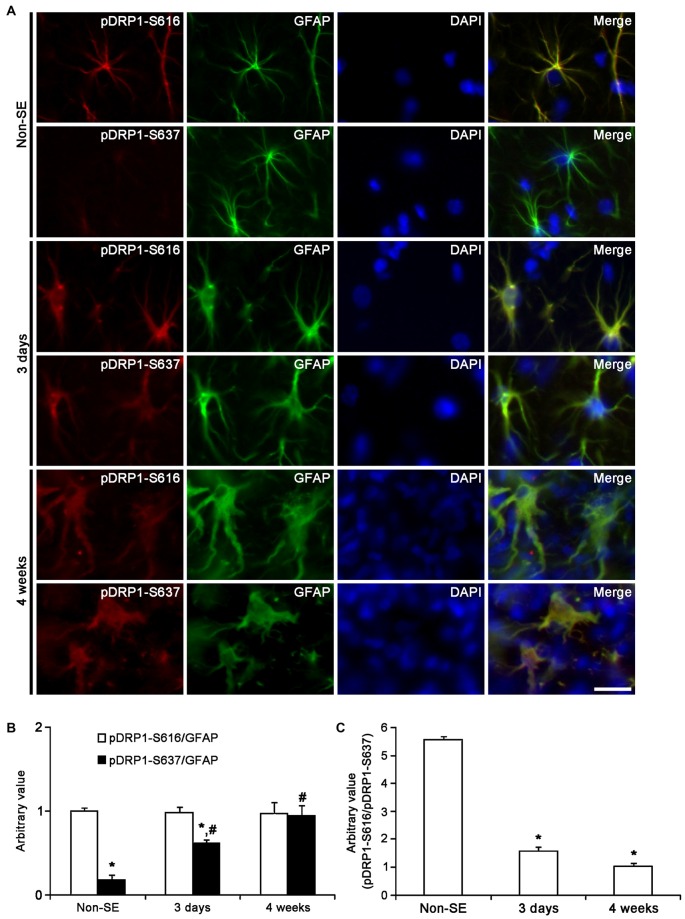
Figure 11.
Astroglial DRP1 phosphorylation in the CA1 region following SE. (A) Double immunofluorescent images for GFAP and pDRP1-S616/-S637 following SE. Three days after SE, both pDRP1-S616 and pDRP1-S637 intensities are enhanced as compared to non-SE animals. Four weeks after SE, pDRP1-S616 intensity is unaltered, but pDRP1-S637 intensity is enhanced as compared to those observed in 3 days after SE. Bar = 12.5 μm. (B) Quantification of the ratio of pDRP1-S616/GFAP and pDRP1-S637/GFAP following SE (mean ± SEM, n = 7, respectively). *p < 0.05 vs. pDRP1-S616/GFAP; #p < 0.05 vs. non-SE animals. (C) Quantification of the ratio of pDRP1-S616/pDRP1-S637 following SE (mean ± SEM, n = 7, respectively). *p < 0.05 vs. non-SE animals.

