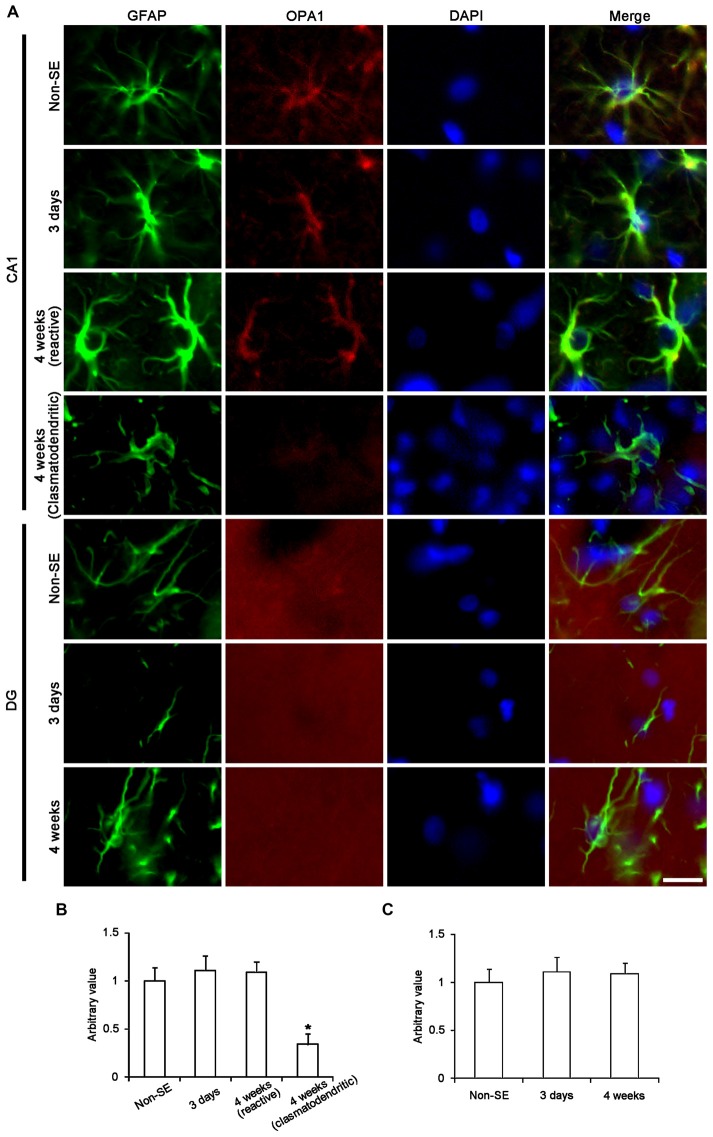
Figure 9.
Astroglial optic atrophy 1 (OPA1) expression in the hippocampus following SE. (A) Double immunofluorescent images for GFAP and OPA1 following SE. In non-SE animals, OPA1 expression is clearly observed in CA1 astrocytes, while its expression is mainly detected in neuropils within the molecular layer of the dentate gyrus. As compared to non-SE animals, OPA1 expression is reduced in clasmatodendritic astrocytes, but not in reactive astrocytes. Bar = 6.25 μm. (B,C) Quantitative values (mean ± SEM) of OPA1 expression in the CA1 region (B) and the molecular layer of the dentate gyrus (C) (n = 7, respectively). *p < 0.05 vs. non-SE animals.

