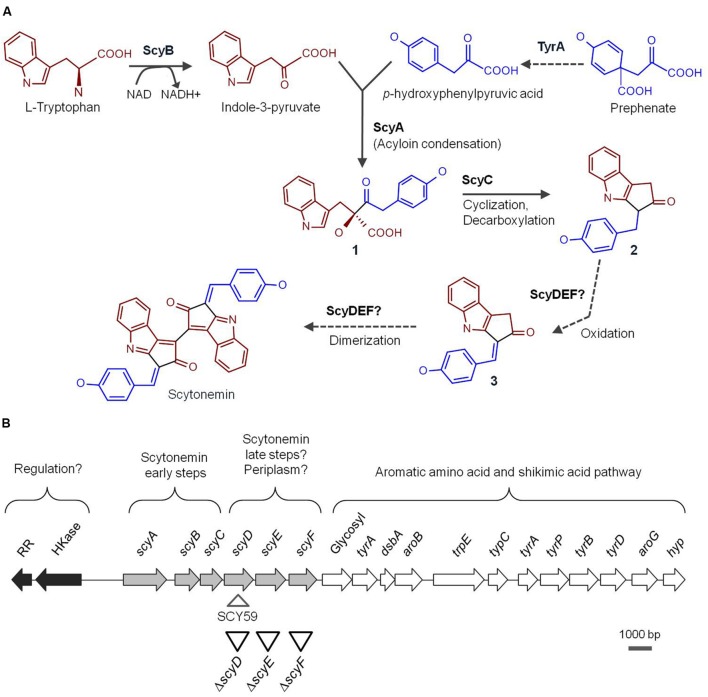
FIGURE 1.
(A) Proposed scytonemin biosynthetic pathway. The names of the enzymes (proved and speculative) involved in the process are written next to the arrows that symbolize reactions catalyzed by them. Bold numbers label the intermediate compounds. (B) Physical map of the Nostoc punctiforme genomic region containing the 18-gene cluster associated with scytonemin production. The arrows represent ORFs and are filled according to the following functional categories: white are scytonemin core genes, light gray are genes associated with aromatic amino acid biosynthesis, and dark gray are putative regulators. Upside down triangles depict approximate locations of the in-frame deletion mutants constructed in this study while the right side up triangle shows the scytoneminless insertion mutant, SCY 59, obtained previously (Soule et al., 2007) and used for comparison purposes in this study.

