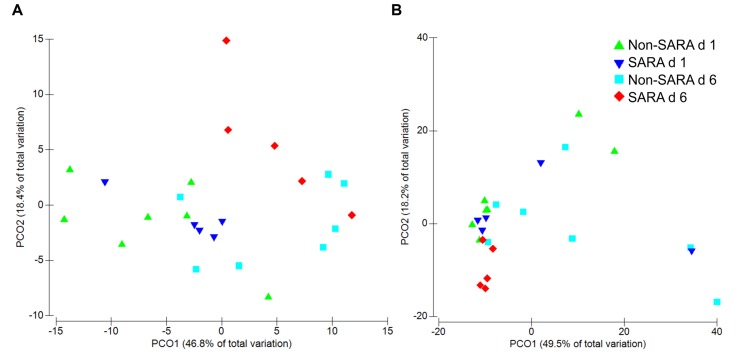
FIGURE 1.
Principal coordinate analysis (PCoA) of beta-diversity in the liquid (A) and solid fraction (B) using Bray–Curtis similarity. Analysis by PERMANOVA revealed a day effect (P = 0.003), but no effect of SARA grouping (SG; P = 0.60) and SG × day (P = 0.18) was observed in the liquid fraction. In the solid fraction, PERMANOVA analysis indicated no effect of day (P = 0.19), SG (P = 0.83), or SG × day (P = 0.43).

