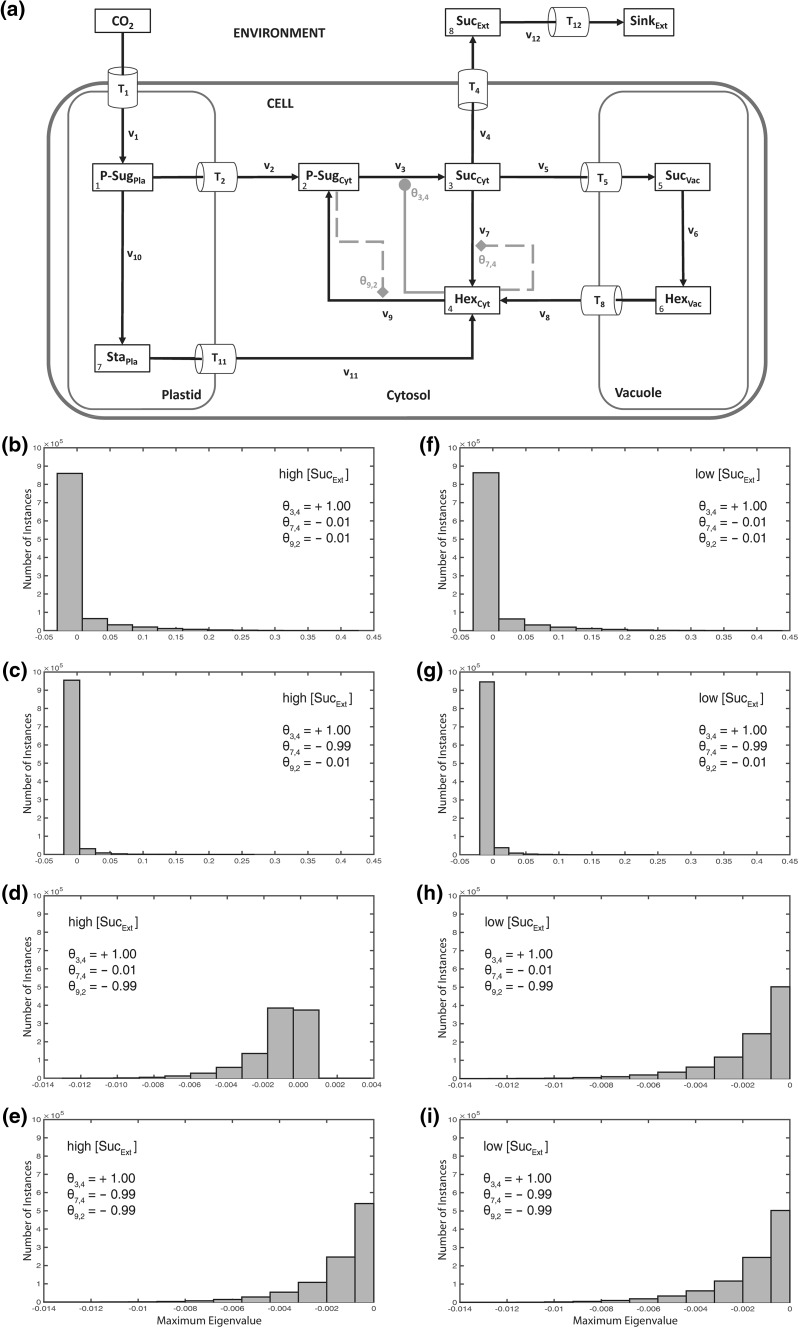
Fig. 3.
Model structure and histograms of maximum eigenvalue real parts with cytosolic activation and inhibition. Calculations for the shown model configuration (a) were performed 106 times for high (b–e), and low (f–i) concentration of extracellular/apoplastic sucrose concentrations. Steps of metabolic activation are indicated by grey filled circles, steps of inhibition are indicated by grey filled diamonds and dashed lines. Particular settings in the θ matrix are indicated within the single histograms. Further detailed information, e.g. about maximum values of the eigenvalue real part distribution, is provided in Supplementary Table S4

