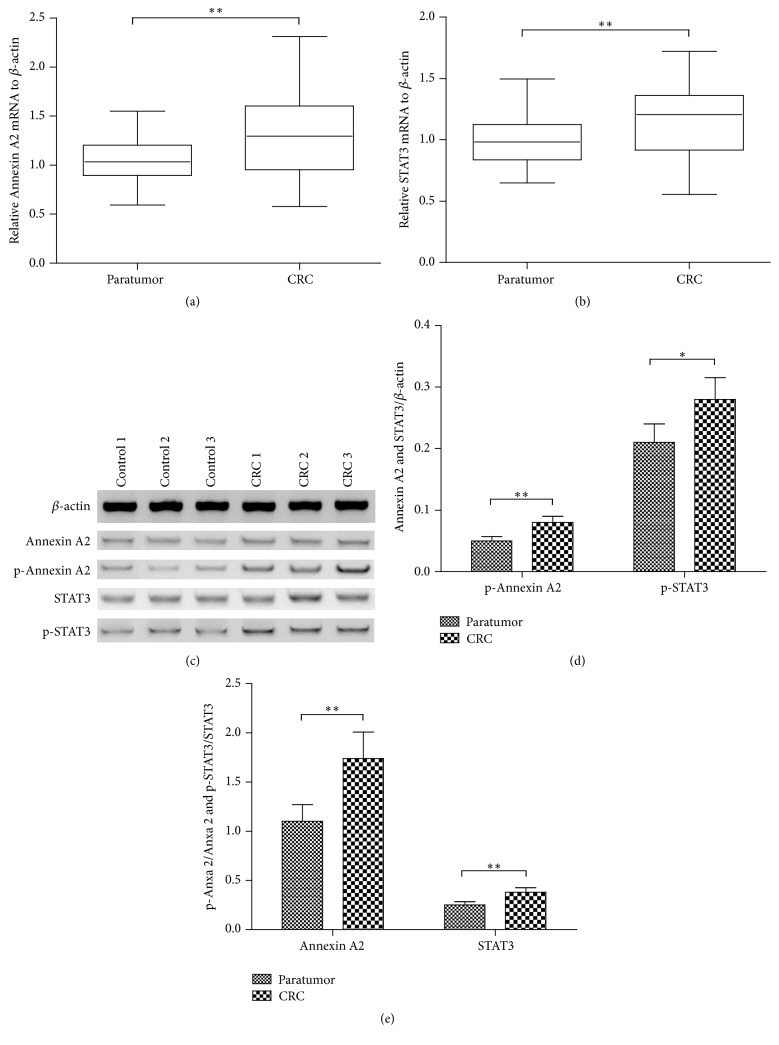
Figure 1.
Comparisons of the expression and the phosphorylation of Annexin A2 and STAT3 between the colorectal cancer (CRC) tissue and the paratumor tissue. (a) and (b) The expression of Annexin A2 (a) and STAT3 (b) in mRNA level was assayed in CRC tissues (n = 35) and in paratumor tissues (n = 35) by relative qRT-PCR analysis; (c) representative western blot analysis of the expression in protein level and the phosphorylation of Annexin A2 (Tyrosine 23) and STAT3 (Tyrosine 705) in CRC tissues (n = 15) and in paratumor tissues (n = 15); (d) relative level of Annexin A2 and STAT3 to β-actin in protein level; (e) relative Annexin A2 and STAT3 with phosphorylation to nonphosphorylated Annexin A2 and STAT3. ∗ and ∗∗ represented p < 0.05 and p < 0.01, respectively.

