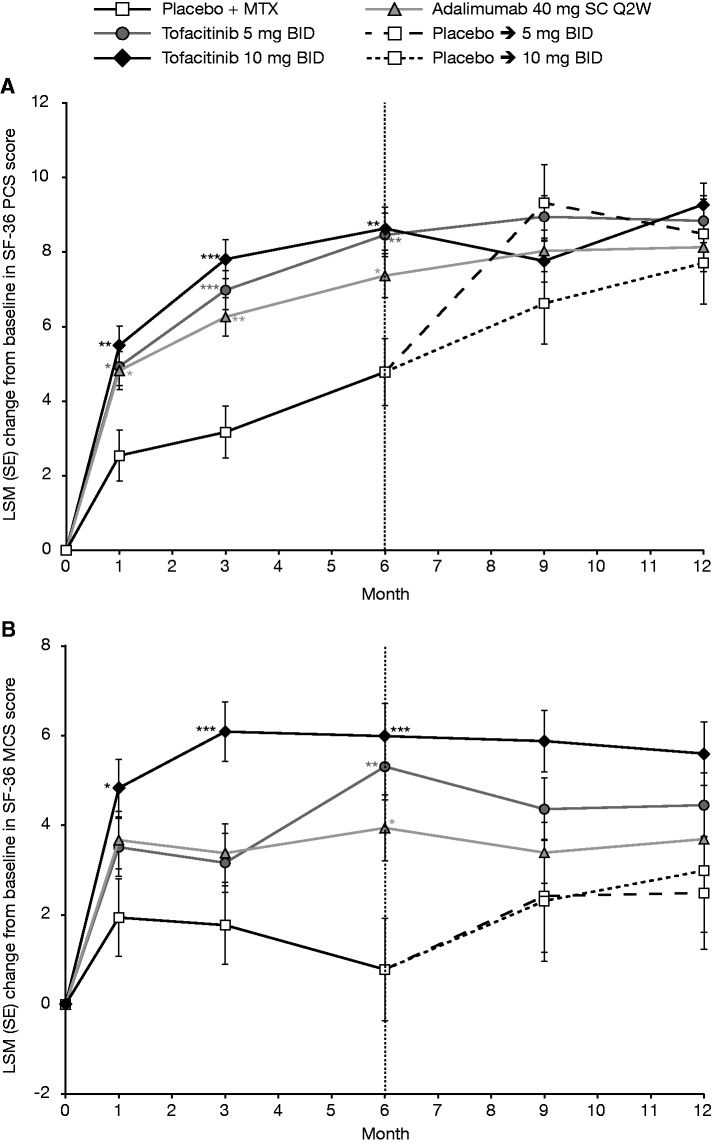
Fig. 3.
LSM (SE) change from baseline in HRQoL (SF-36) (full analysis set, longitudinal model)
*P ≤ 0.05, **P < 0.001 and ***P < 0.0001 vs placebo + MTX. (A) Physical Component Summary score; (B) Mental Component Summary score. Each individual graph has two separate analyses plotted. For baseline to month 6, patients who advanced at month 3 had their month 6 value set to missing for the purpose of statistically testing vs placebo. For post-month 6, all available patient data are included. BID: twice daily; HRQoL: health-related quality of life; LSM: least squares mean; MCS: Mental Component Summary; MTX: methotrexate; PCS: Physical Component Summary; Q2W: once every 2 weeks; SC: subcutaneous; SE: standard error; SF-36: Short Form-36.

