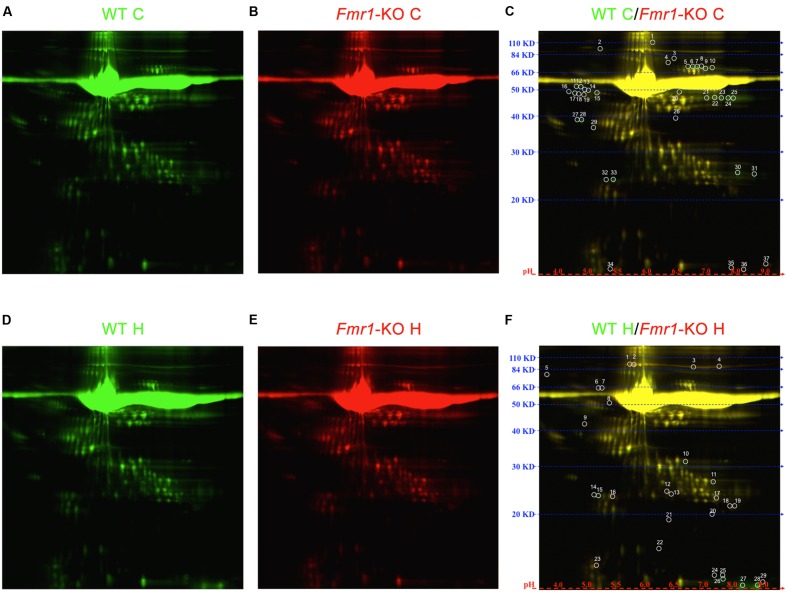
FIGURE 4.
2D DIGE of cortical and hippocampal ACM. Proteome map of ACM from (A) WT cortical samples or (B) Fmr1-KO cortical samples. (C) 37 spots showed at least 50% expression difference in ACM from Fmr1-KO cortices relative to their WT counterparts. Proteome map of ACM from (D) WT hippocampal samples or (E) Fmr1-KO hippocampal samples. (F) 29 spots showed at least 50% expression difference in ACM from Fmr1-KO hippocampi. Abbreviations: WT, wild type; Fmr1-KO, Fmr1 knockout; ACM, astrocyte conditioned media; C, cortical; H, hippocampal; 2D DIGE, two-dimensional difference in gel electrophoresis.

