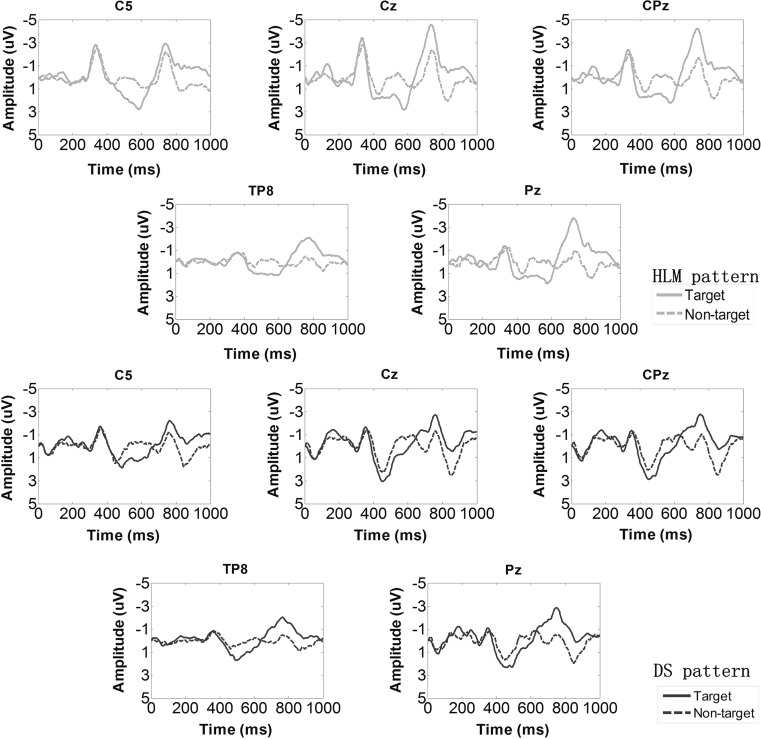
Fig. 3.
Grand averaged ERP amplitudes across 10 participants in the HLM and DS patterns over five channels: C5, Cz, CPz, TP8, and Pz. Red solid lines indicate the target group and red dashed lines indicate the non-target group in the HLM pattern. Blue solid lines indicate the target group and blue dashed lines the non-target group in the DS pattern. (Color figure online)

