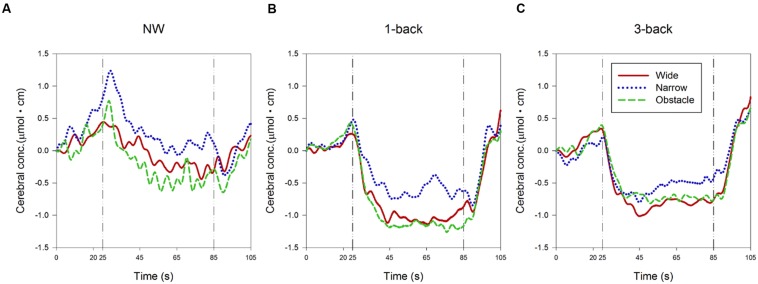
FIGURE 4.
Presentation of changes in the relative concentration level of HbO during (A) normal walking, (B) dual-tasking with the 1-back task, and (C) dual-tasking with the 3-back task from pre-test quiet standing (0–20 s), countdown block (20–25 s), test block (25–85 s), and post-test quiet standing (85–105 s). Graphs are showed as ensemble-averaged waveforms from 24 participants for different combinations of cognitive task complexity and walking road condition.

