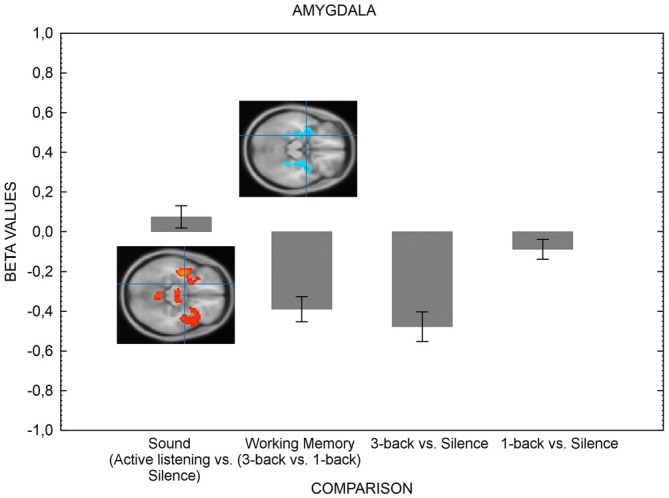
Figure 3.

The figure shows the amygdala’s activation in various conditions. The left hemisphere only is shown for simplicity, but the result pattern was the same for right hemisphere. The suppression of amygdala is greater when the cognitive load of the visual-verbal working memory task is high in comparison with when load is low. Error bars represent standard error of means. The inserts shows results (bars indicate means of parameter estimates (±SEM, arbitrary units) at the level of the amygdala (crossmark). Activation is depicted in red and deactivation is depicted in blue for the active listening vs. silence contrast and the 3-back vs. 1-back contrast. As can be noted, there is no discernable activation in the active listening vs. silence contrast. The contrasts displayed in the Figure resulted from four one-sample t-tests, testing for the effect of sound (active listening vs. silence, T = 5.39, FWE corrected p < 0.05, k = 0), working memory load (3-back > 1-back, T = 5.31, FWE corrected p < 0.05, k = 0), 3-back vs. silence (T = 5.30, FWE corrected p < 0.05, k = 0) and 1-back vs. silence (T = 5.40, FWE corrected p < 0.05, k = 0). The coordinates for the contrasts are shown in Table 4.
