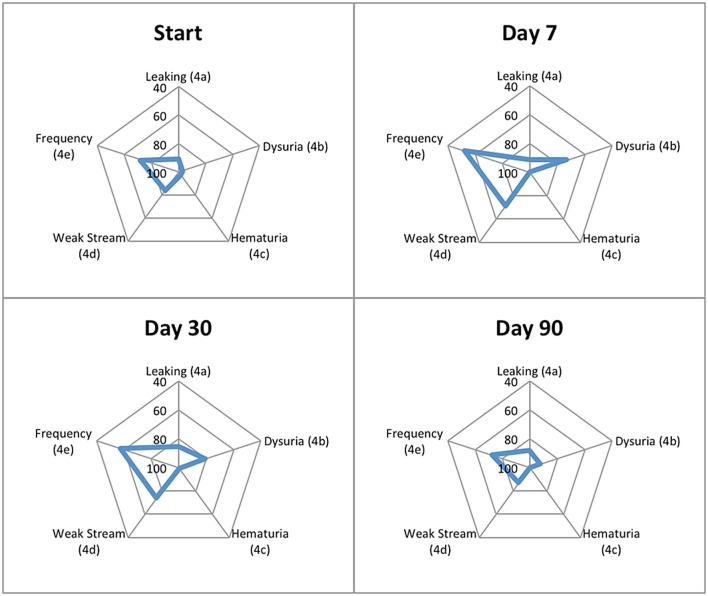
Figure 6.
Radar plots showing the distribution of individual symptom bother following SBRT for prostate cancer. EPIC-26 scores range from 0 to 100 with lower values representing worse symptoms. Points further from center indicate higher levels of bother for a given symptom. EPIC-26 question number is shown in parentheses.

