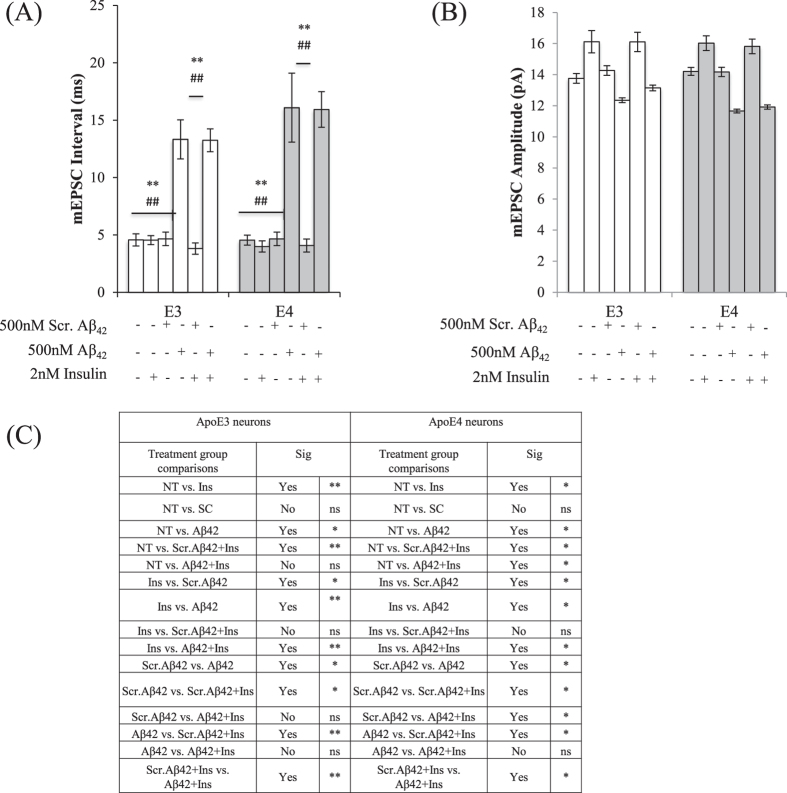
Figure 5. Insulin stimulation increased mEPSC amplitudes but did not rescue Aβ42-induced down-regulation of AMPA mEPSC frequencies and amplitudes in both ApoE3 and ApoE4 neurons.
(A) mEPSC interval histograms from ApoE3 and ApoE4 hippocampal neurons. Insulin treatment has no effect on mEPSC intervals while Aβ42 pre-treatment significantly increased mEPSC intervals in both ApoE3 and ApoE4 neurons (One-way ANOVA, F = 26.40,17.32 respectively). In both ApoE3 and ApoE4 neurons, Aβ42 (**p < 0.01) and Aβ42+Ins (##p < 0.01) treated neurons showed significant increases in mEPSC intervals when compared to other treatment groups (Tukey-Kramer). (B) mEPSC amplitude histograms from ApoE3 and ApoE4 hippocampal neurons. Insulin treatment increased mEPSC amplitudes in both ApoE3 and ApoE4 neurons (**p < 0.01, *p < 0.05) (One-way ANOVA, F = 11.17, 5.722, respectively, Tukey-Kramer). (C) Summary of post-hoc Tukey-Kramer analysis. Error bars represent ± SEM (n = 6). NT refers to no treatment.

