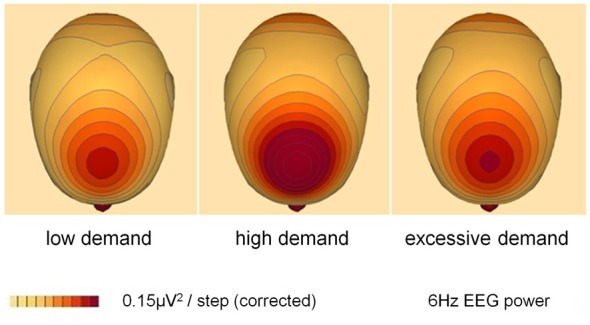
Figure 3.

Grand average topographic distribution of spectral power at the frequency of peak power for low, high and excessive demand (N = 20: incentive and no-incentive conditions are collapsed). Peak frequency = 6 Hz (the frequency at which a clear peak in EEG power was evident within the 4–7 Hz range); this was identified by visual inspection of the grand average frequency-power spectral plot. Images were constructed using spherical spline interpolation.
