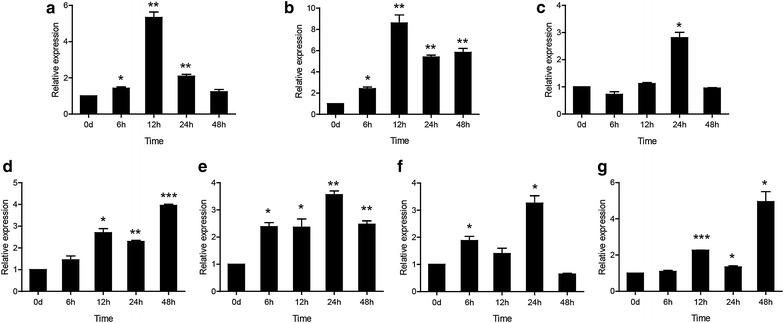
Fig. 5.

The relative expression levels of CcTollip in various tissues of common carp after i.p. injection with poly(I:C). Relative expression of CcTollip in the liver (a), spleen (b), head kidney (c), foregut (d), hindgut (e), gills (f) and skin (g) of the common carp at different time points is shown; these results were calculated relative to the expression of the 40S ribosomal protein S11 gene. All samples were analyzed in triplicate. Each bar represents the mean ± SD, n = 3; *p < 0.05, **p < 0.01 and ***p < 0.001 versus the control group (denoted by 0 h). The experiments were repeated three times
