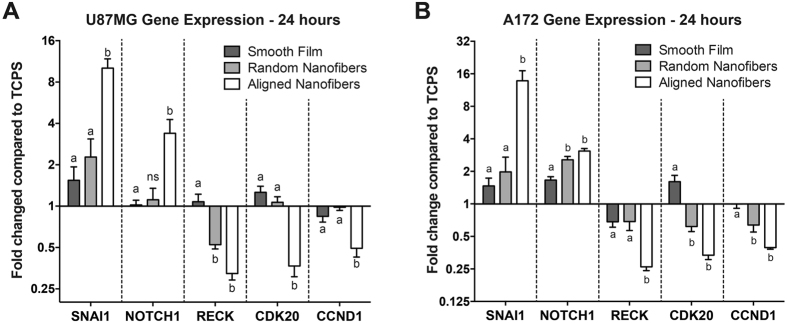
Figure 6. Aligned nanotopography resulted in the most significant increase in pro-migratory and decrease in pro-proliferative gene markers.
Quantitative real time PCR for gene expression in U87MG (A) and A172 (B) cells when plated on TCPS, smooth film, randomly aligned nanofibers, and aligned nanofibers for 24 hours. Results are shown with fold expression relative to the TCPS condition. Aligned nanotopography resulted in the significant upregulation of pro-migratory marker SNAI1 and NOTCH1, downregulation of anti-migratory marker RECK, and decreased pro-proliferative markers CDK20 and CCND1 (p < 0.05). N = 3, mean ± SEM.

