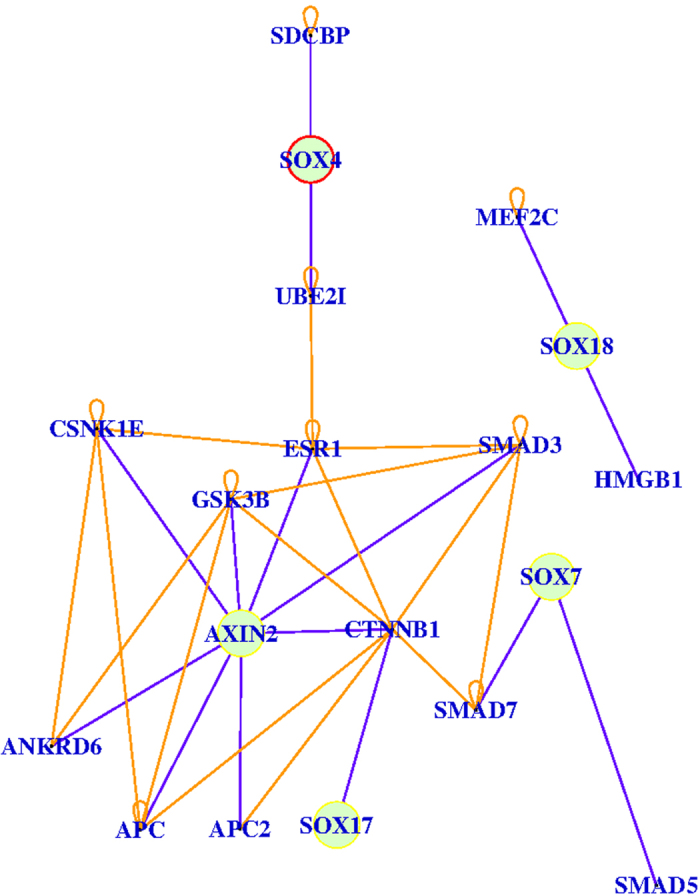
Figure 7. SOX4/SOX7/SOX17/SOX18/AXIN2 relation.

The picture shows the relation between SOX4, SOX7, SOX17, SOX18 and AXIN2 according to the DOLITE category. The nodes in green are the interested genes. The blue range edges are direct links, the orange ones are indirect links. The yellow circle represents down-regulation, while the red circle means up-regulation.
